Independent product experiment
Halfmoon
Ad spend rules you can test before they run, and AI agents that show their working before they touch your money.
Concept · Figma + codeTL;DR
Growth teams already let software move their ad budgets, and they still can’t preview what a rule will do. Halfmoon lets them test a rule on live data before it runs. When AI agents take over the day-to-day calls, every decision arrives with the evidence behind it, and anything above a guardrail waits for a person to approve it.
The Short Version
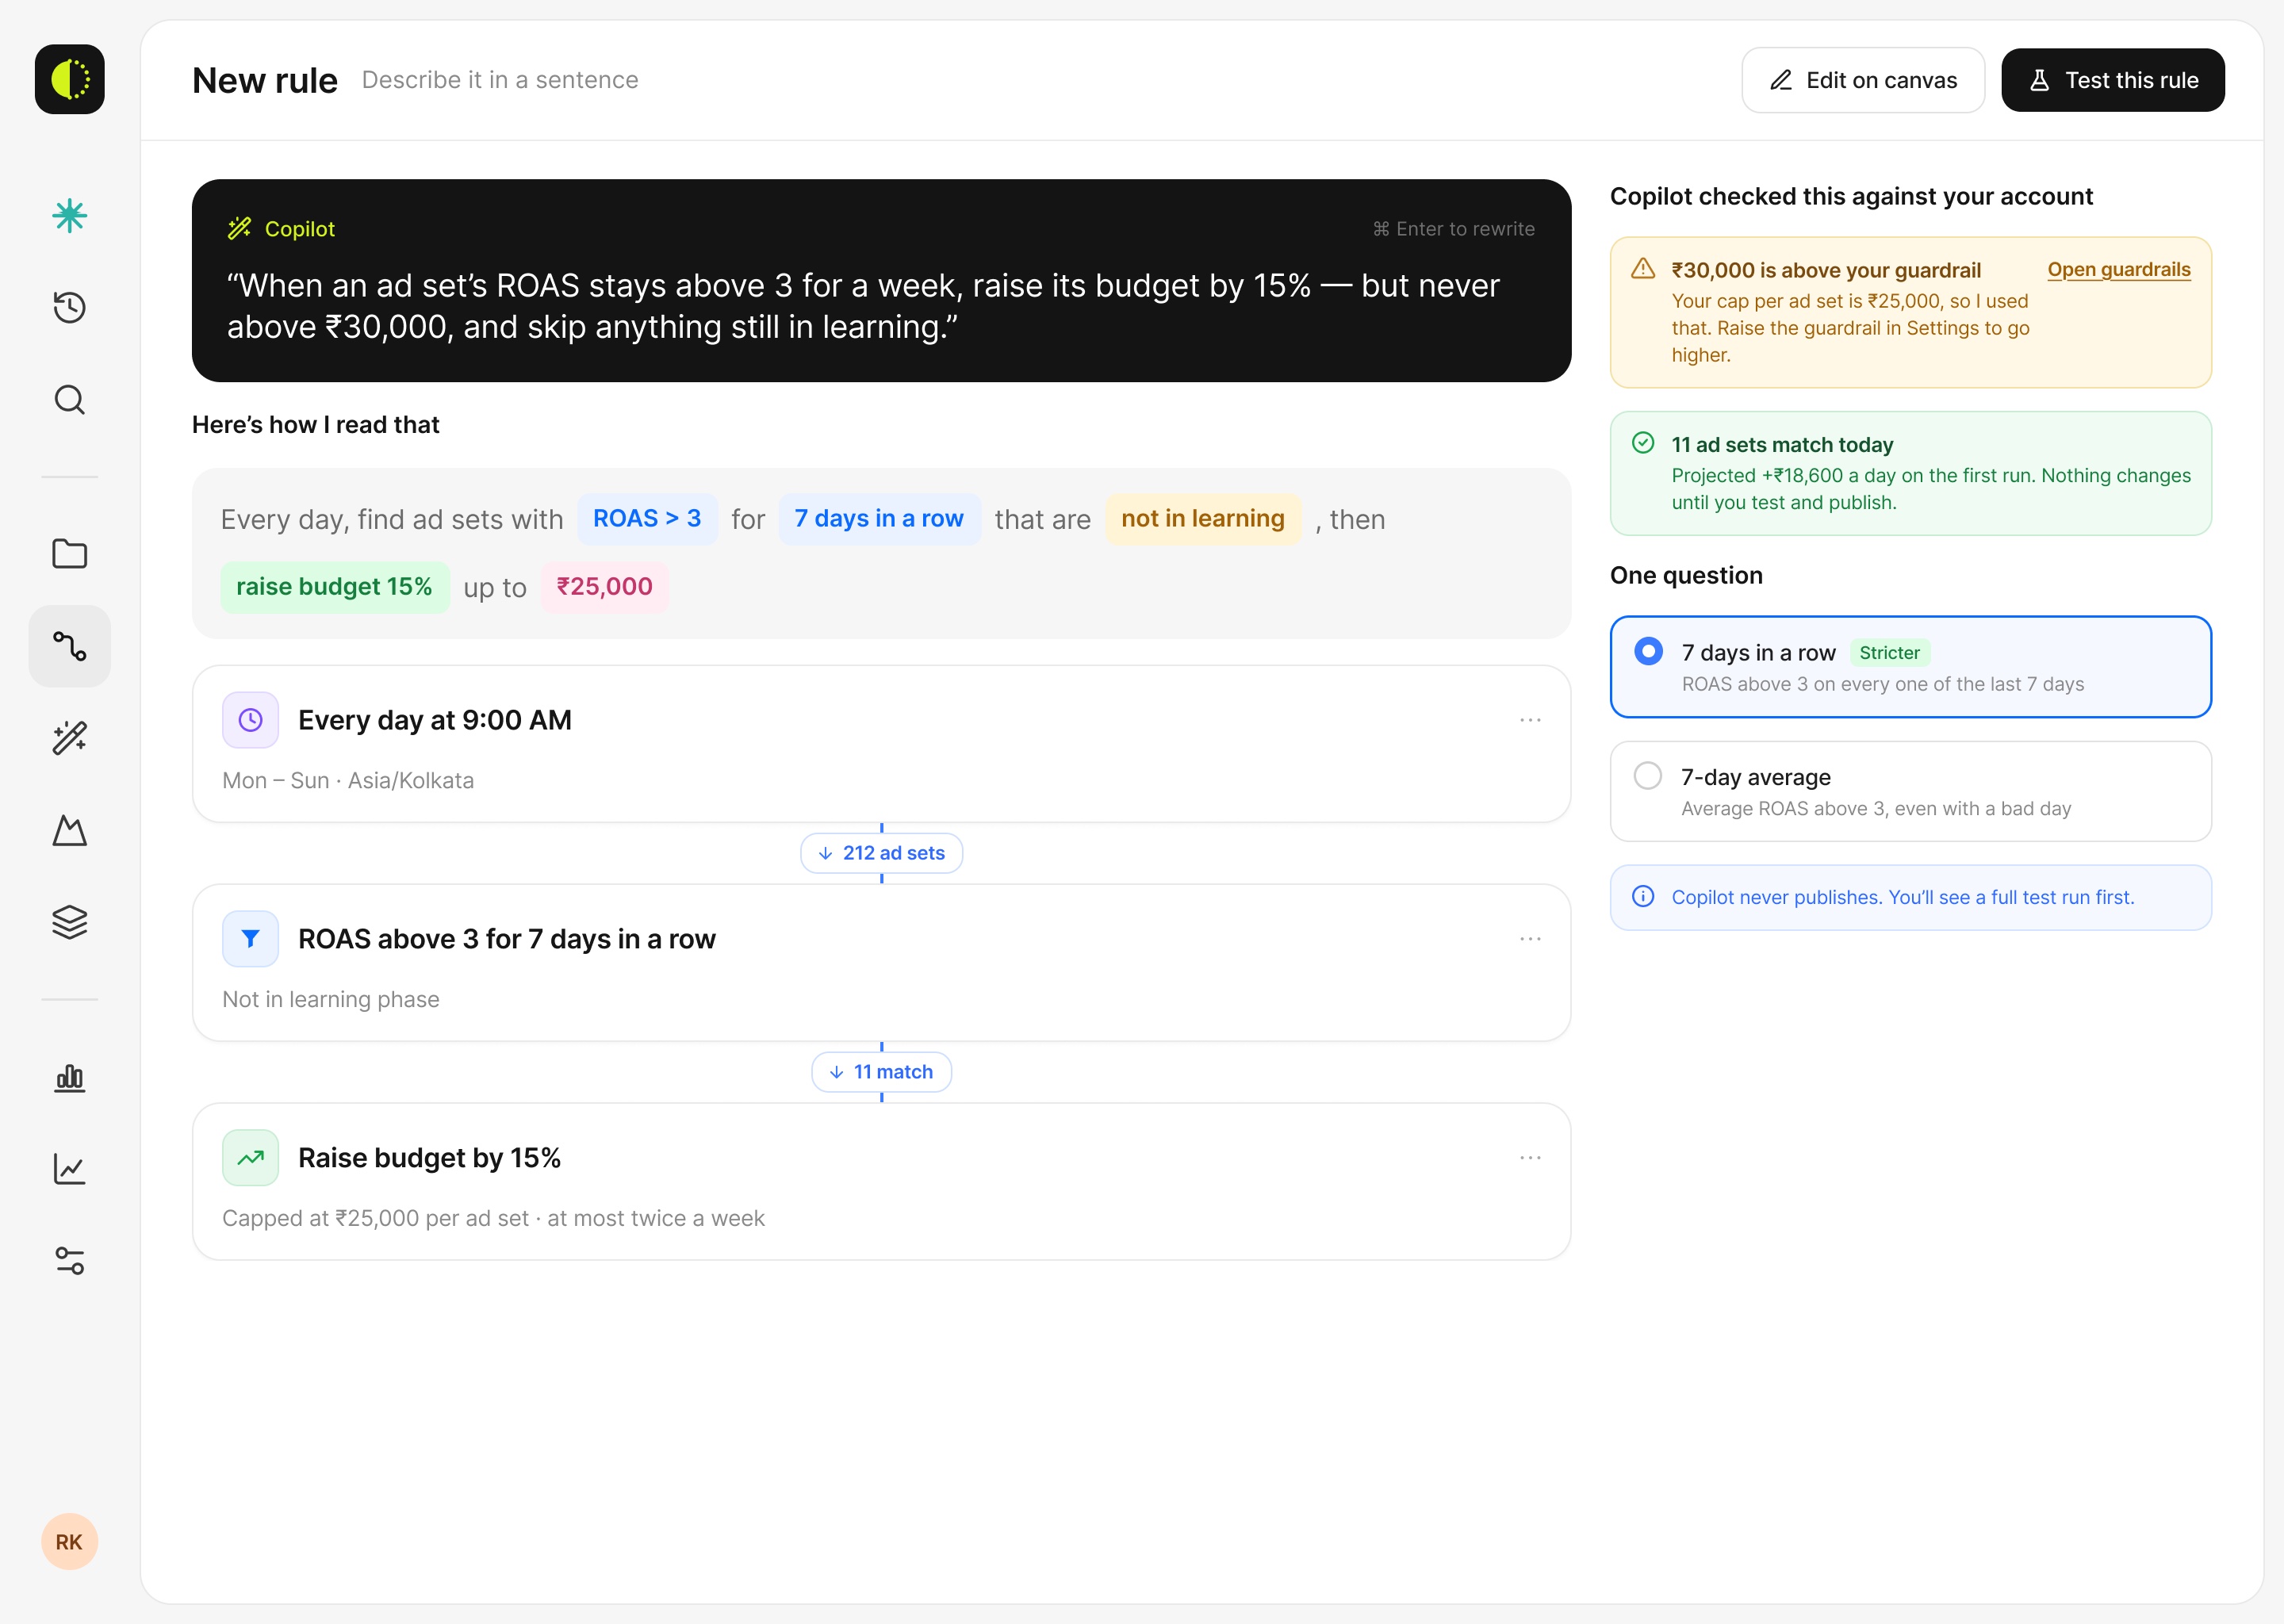
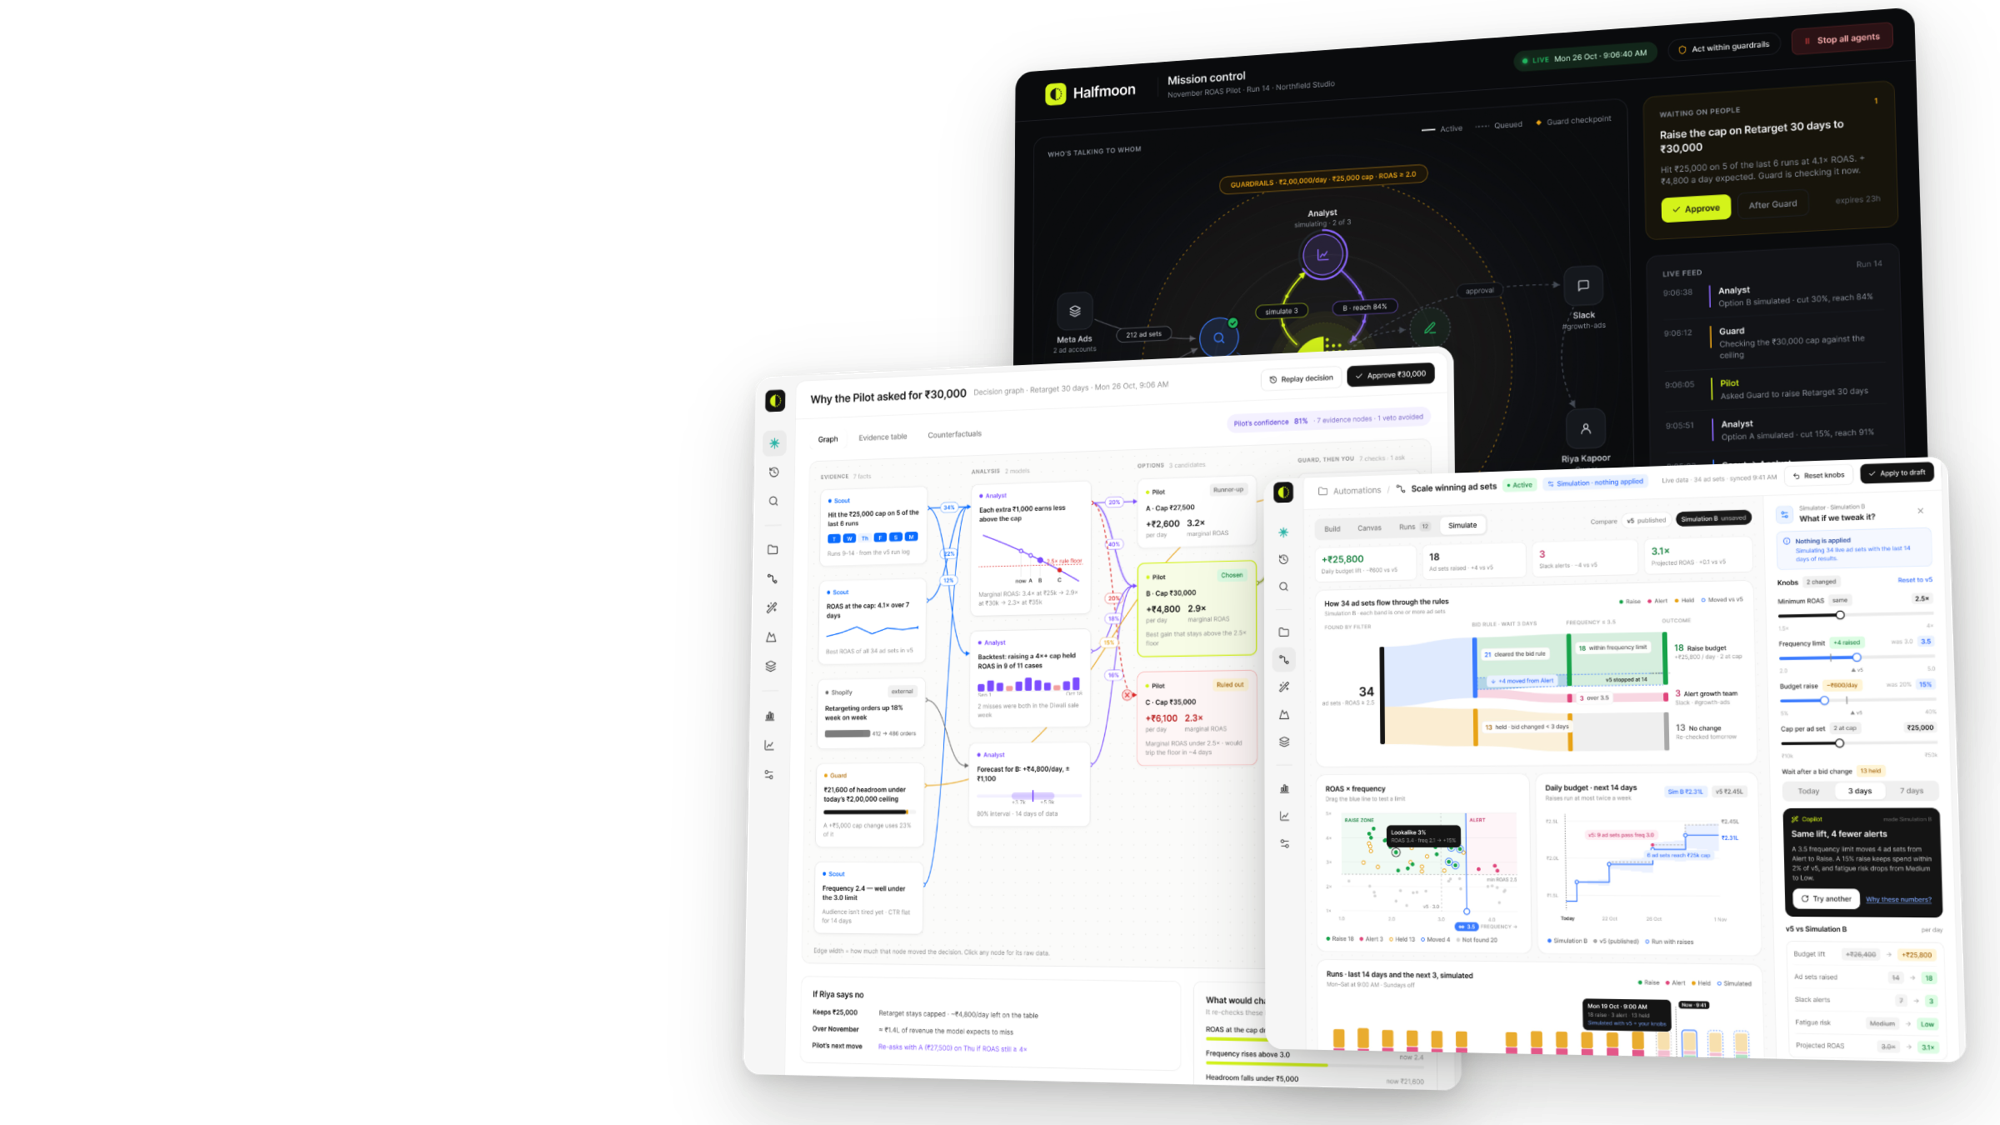
Halfmoon is a concept for teams running Meta Ads. You write a rule in plain words, test it against the last 14 days, drag its thresholds in a simulator and publish it with a rollback already in place. The second half hands the work to a Pilot agent and five specialists, and designs the screens a marketer needs before trusting them with a budget.
The Mess
Budget rules are written blind. You set a threshold, and you find out what it did after the money is spent. One wrong number can scale a tired ad set or kill a winner overnight, and a rule that misfires on 30 ad sets can burn a week of budget before anyone looks. Teams want to automate. What holds them back is that they can’t see the result first.
My Part in This
- Framed the product around one question: can I trust this before it touches money?
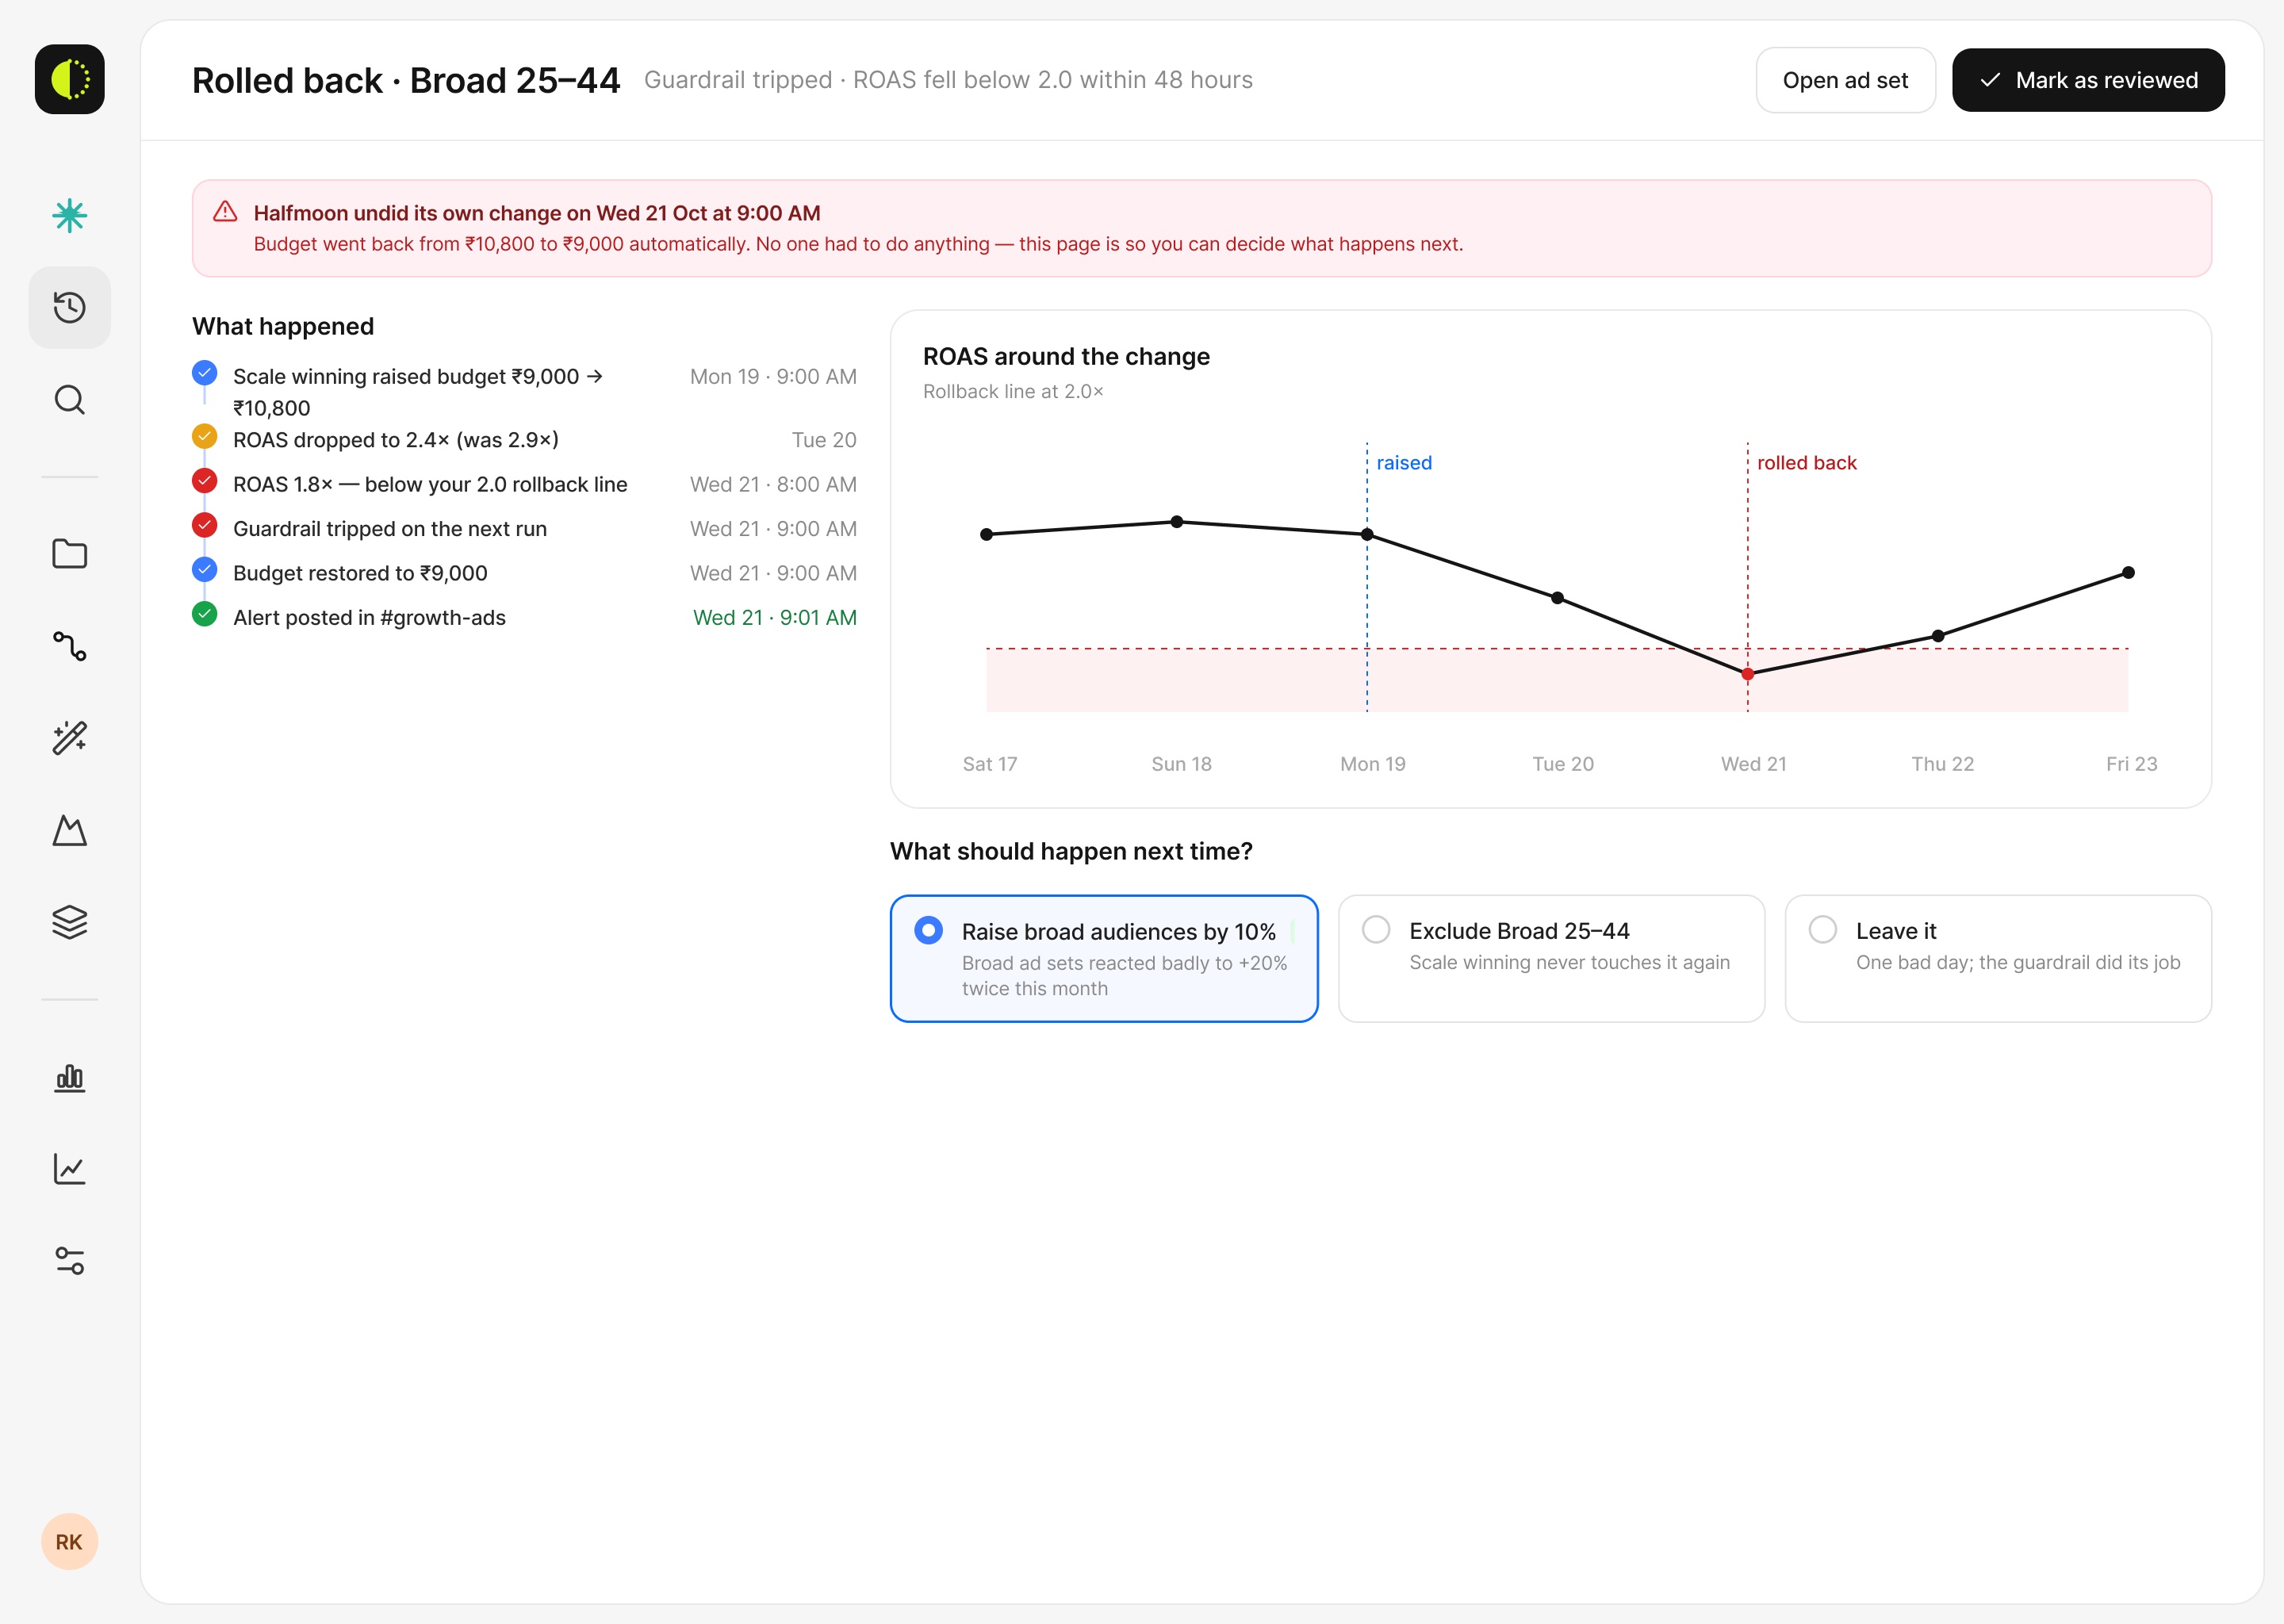
- Designed the launch flow from sign-in to a first published rule, then the simulator, publish review and rollback.
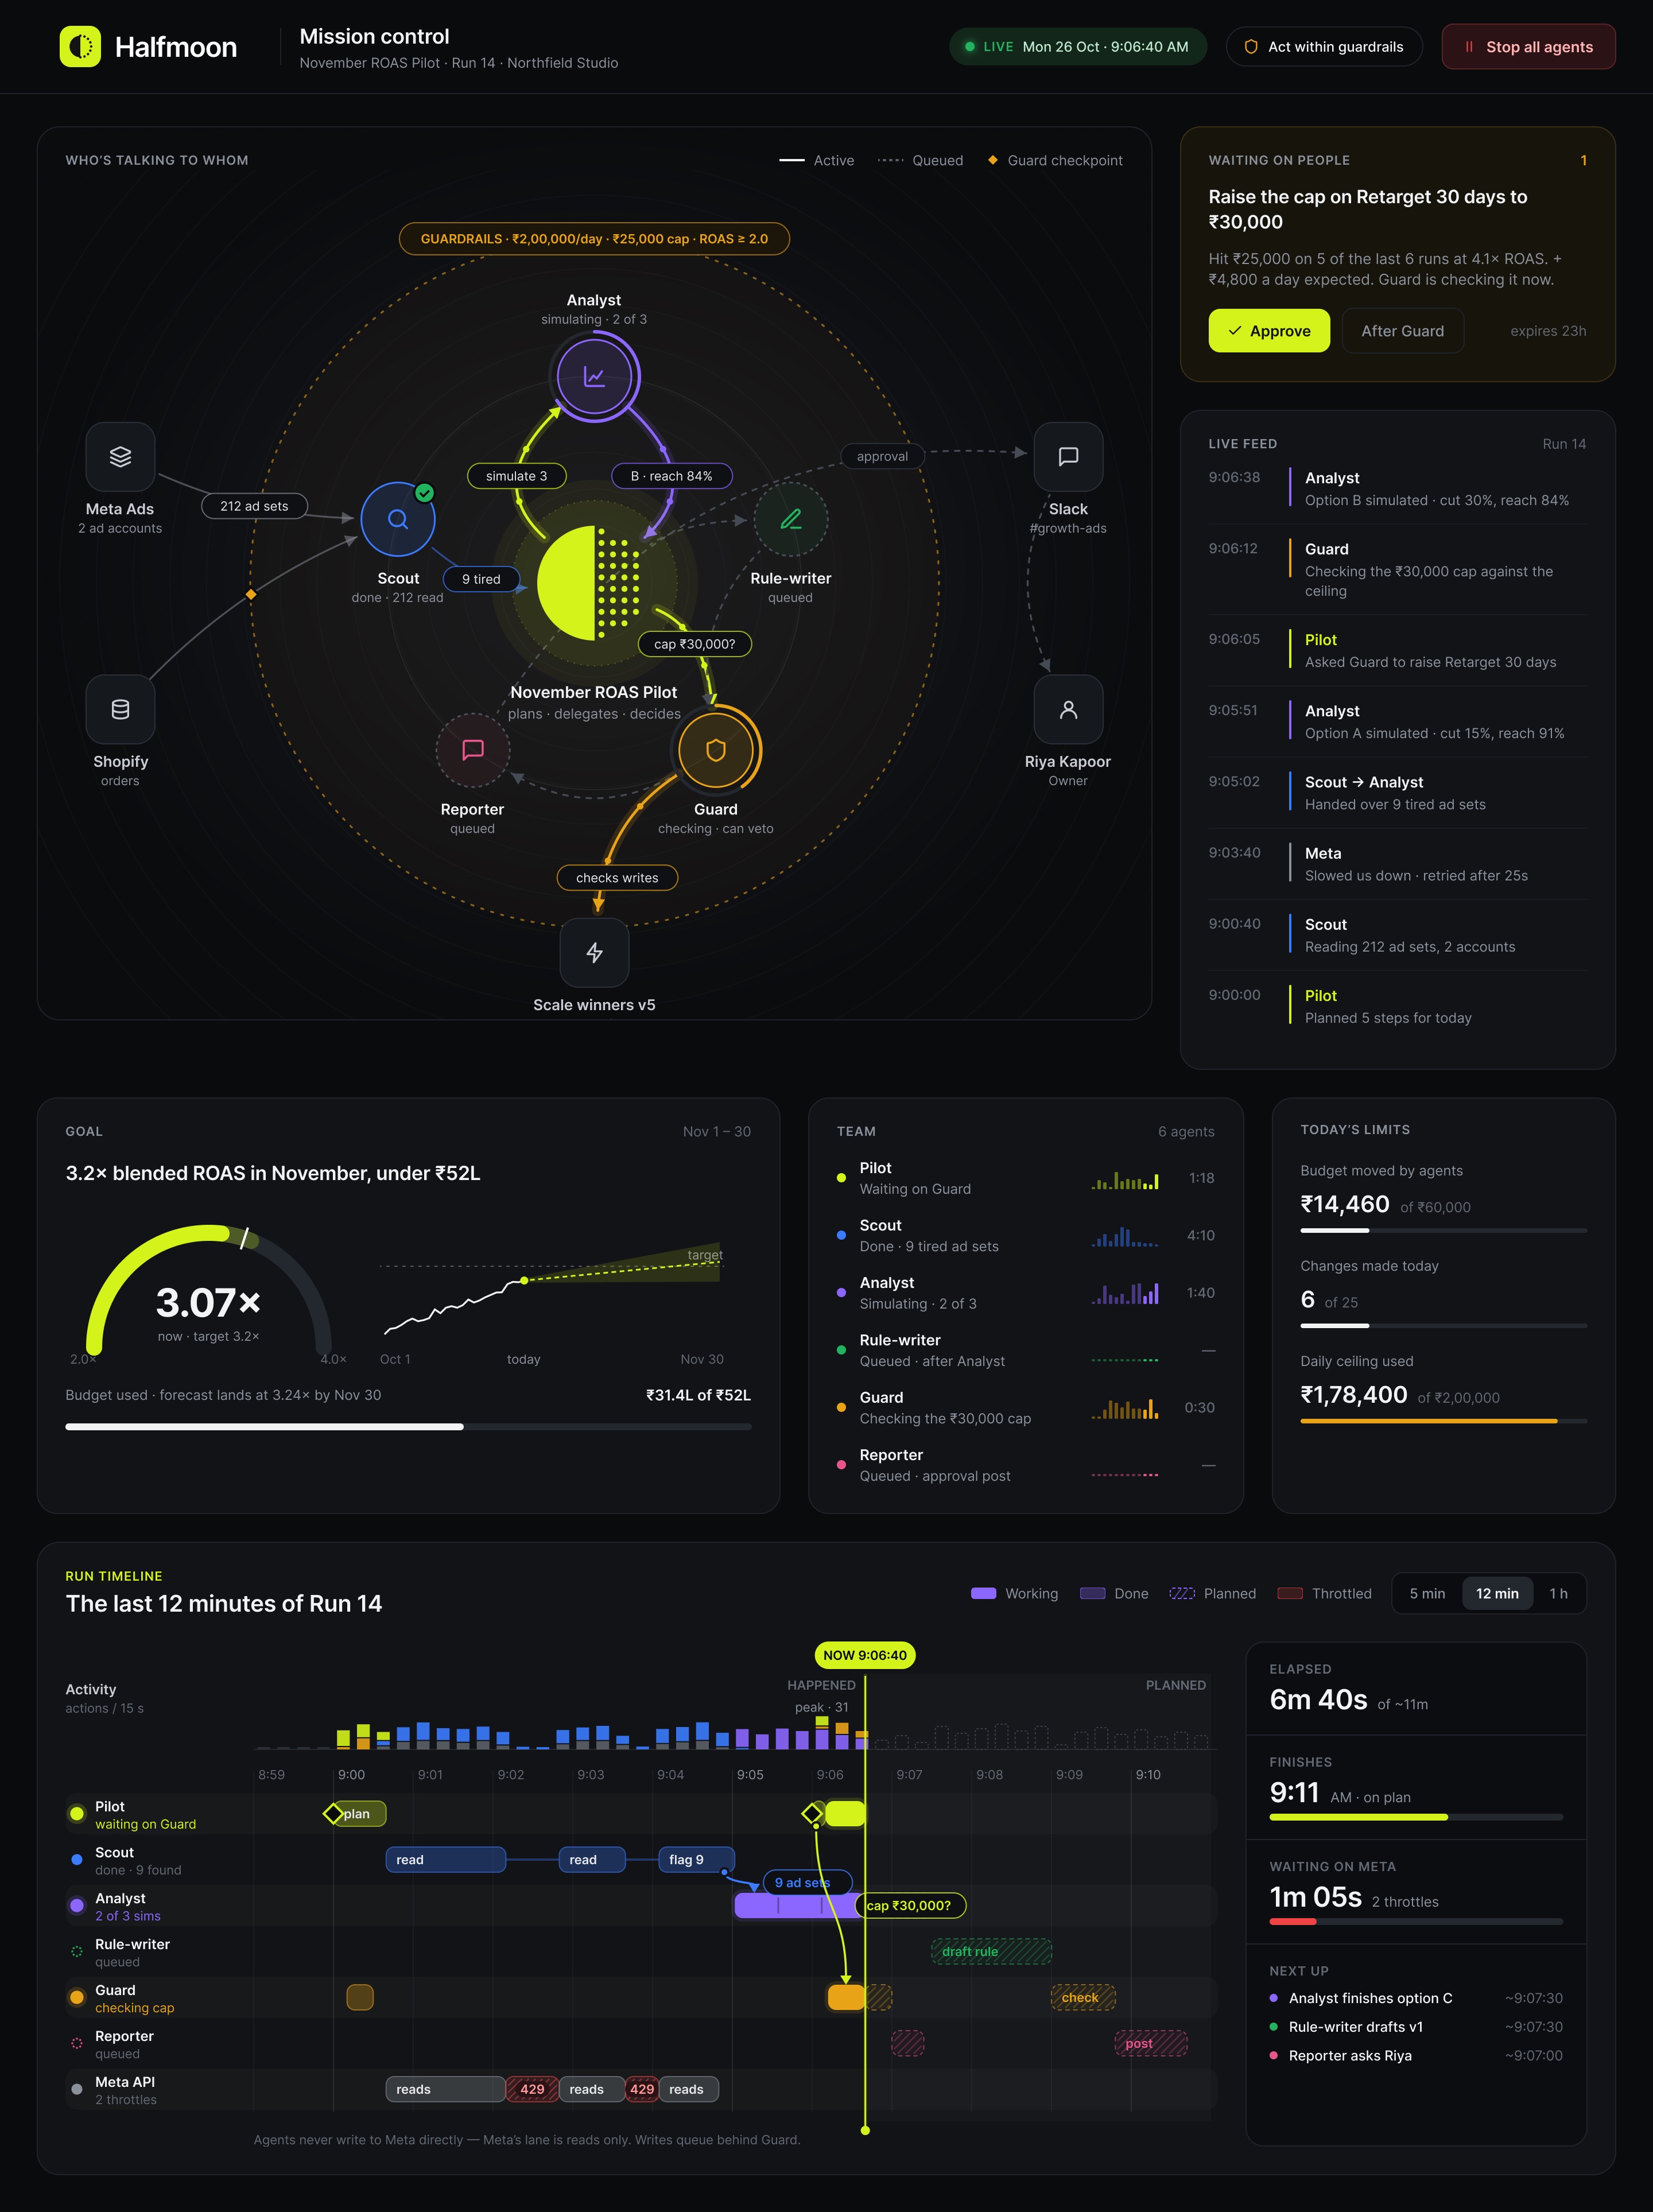
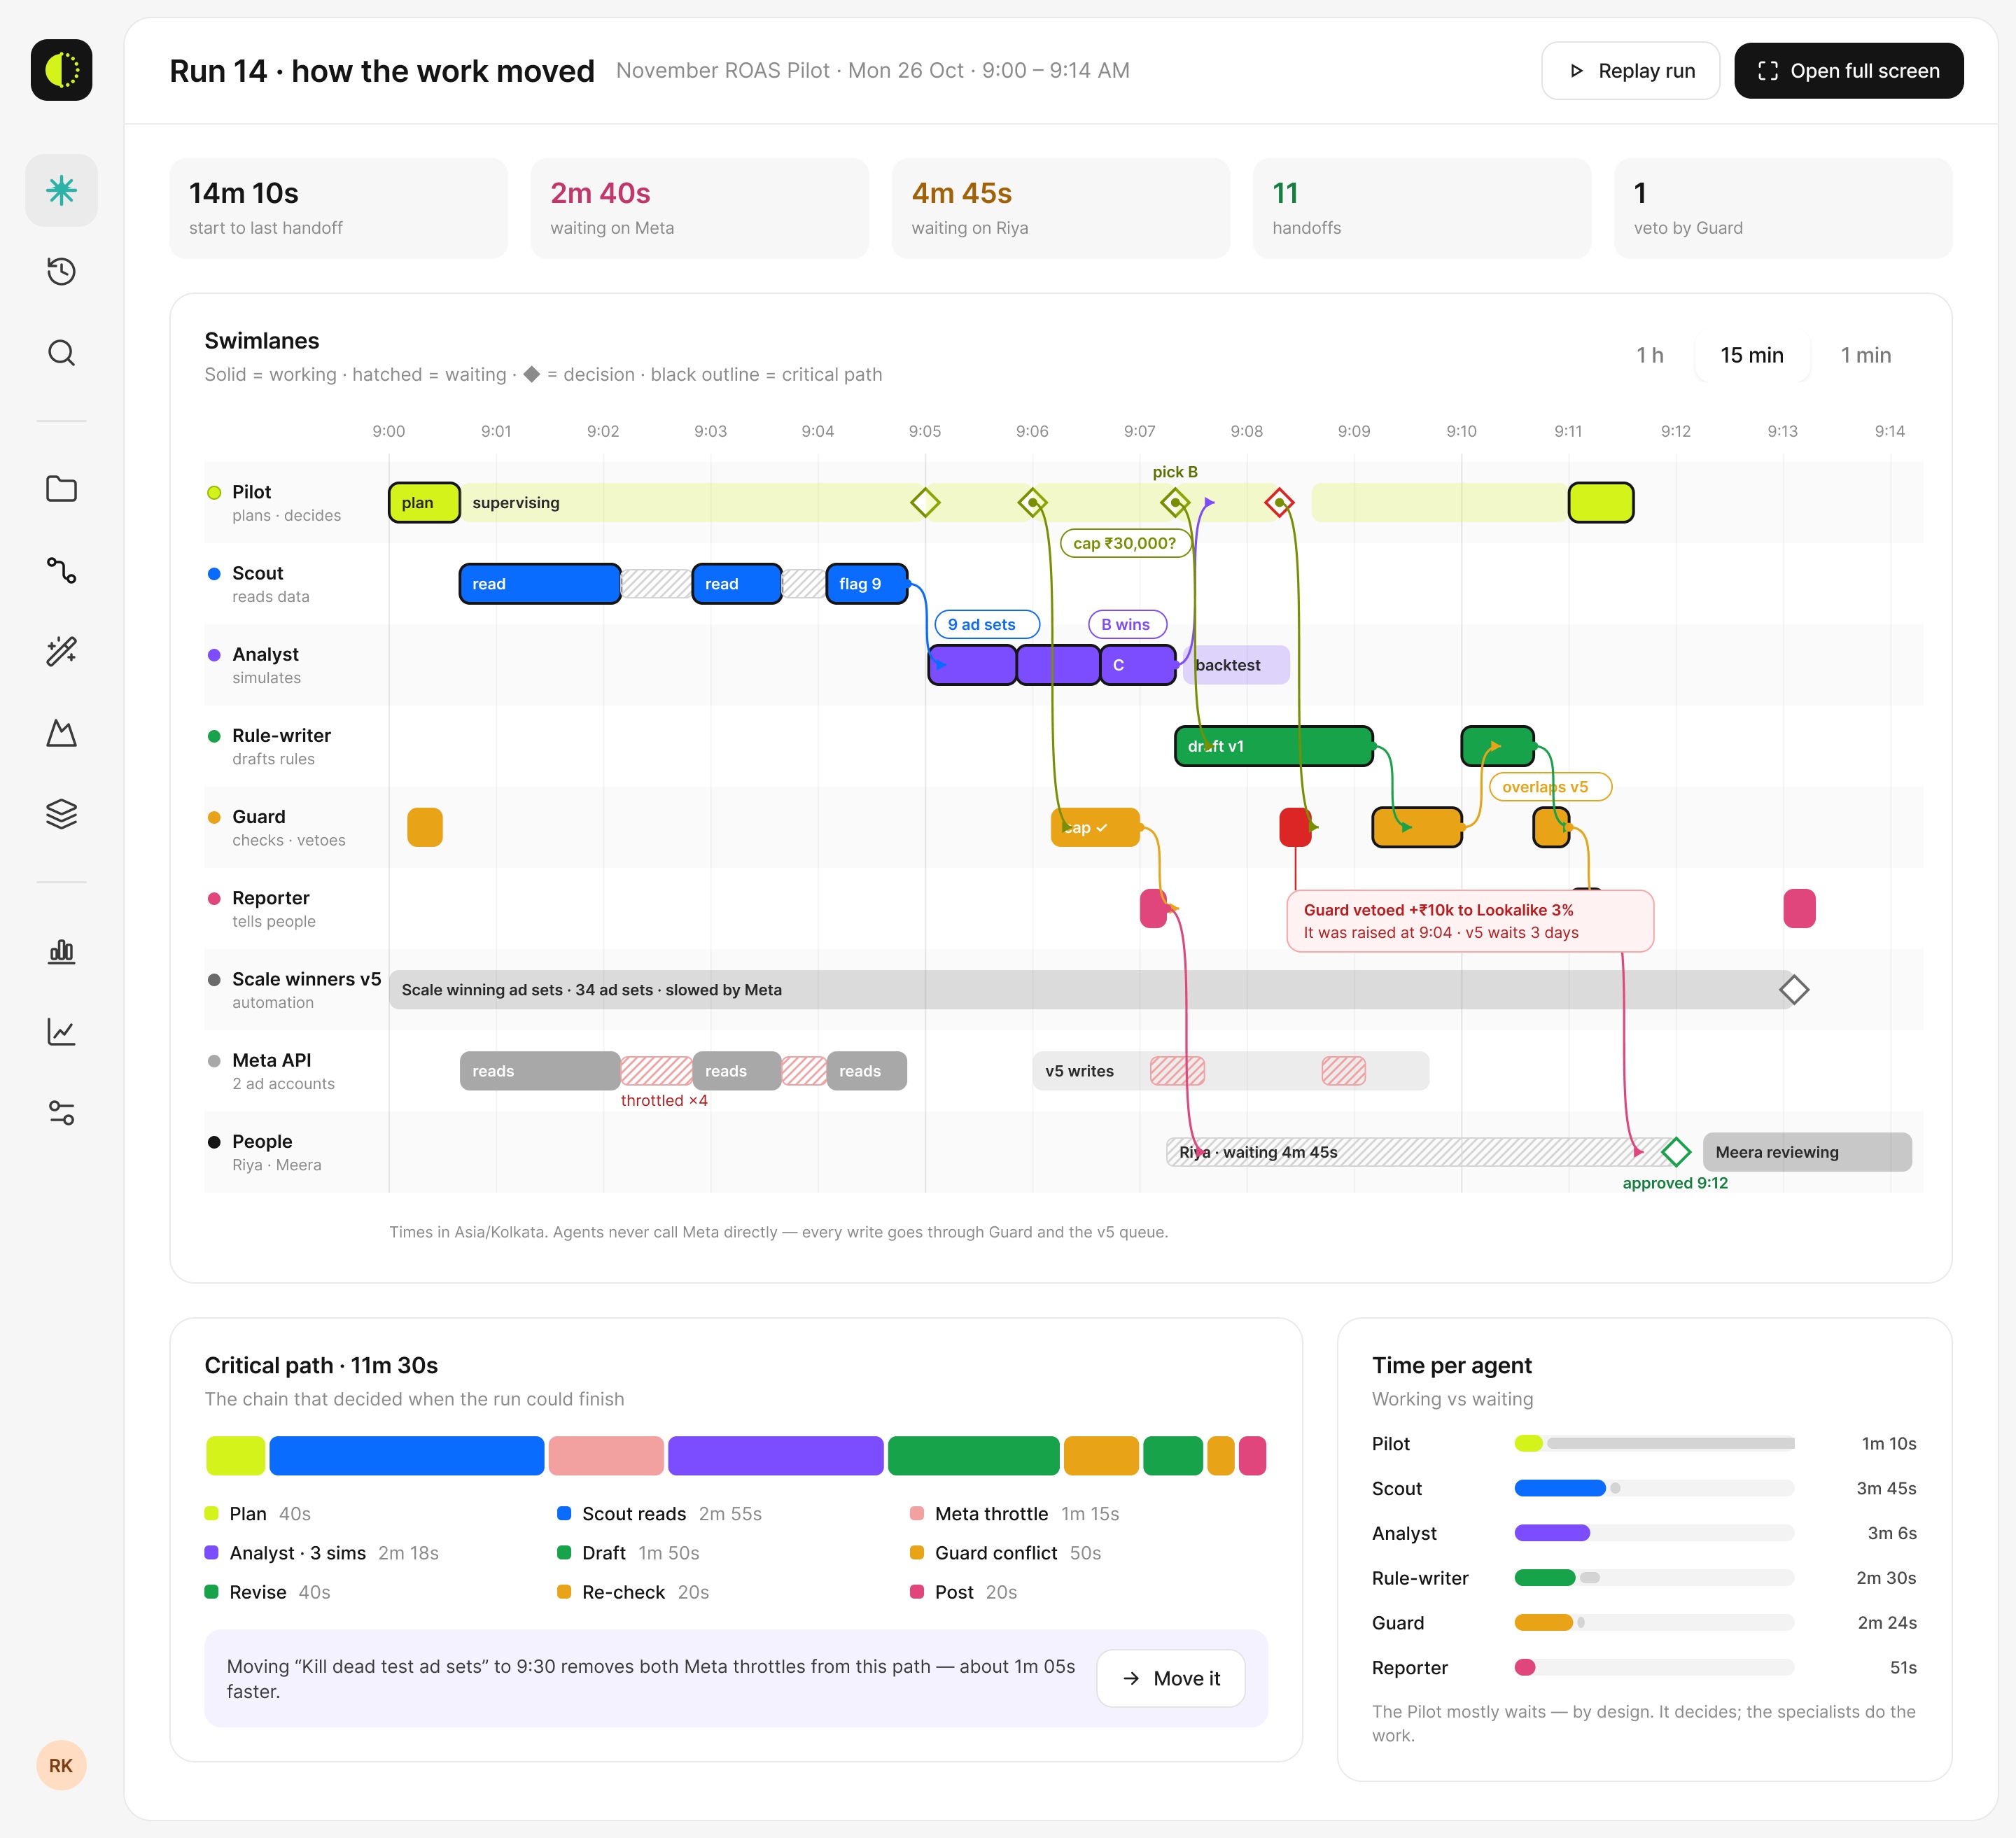
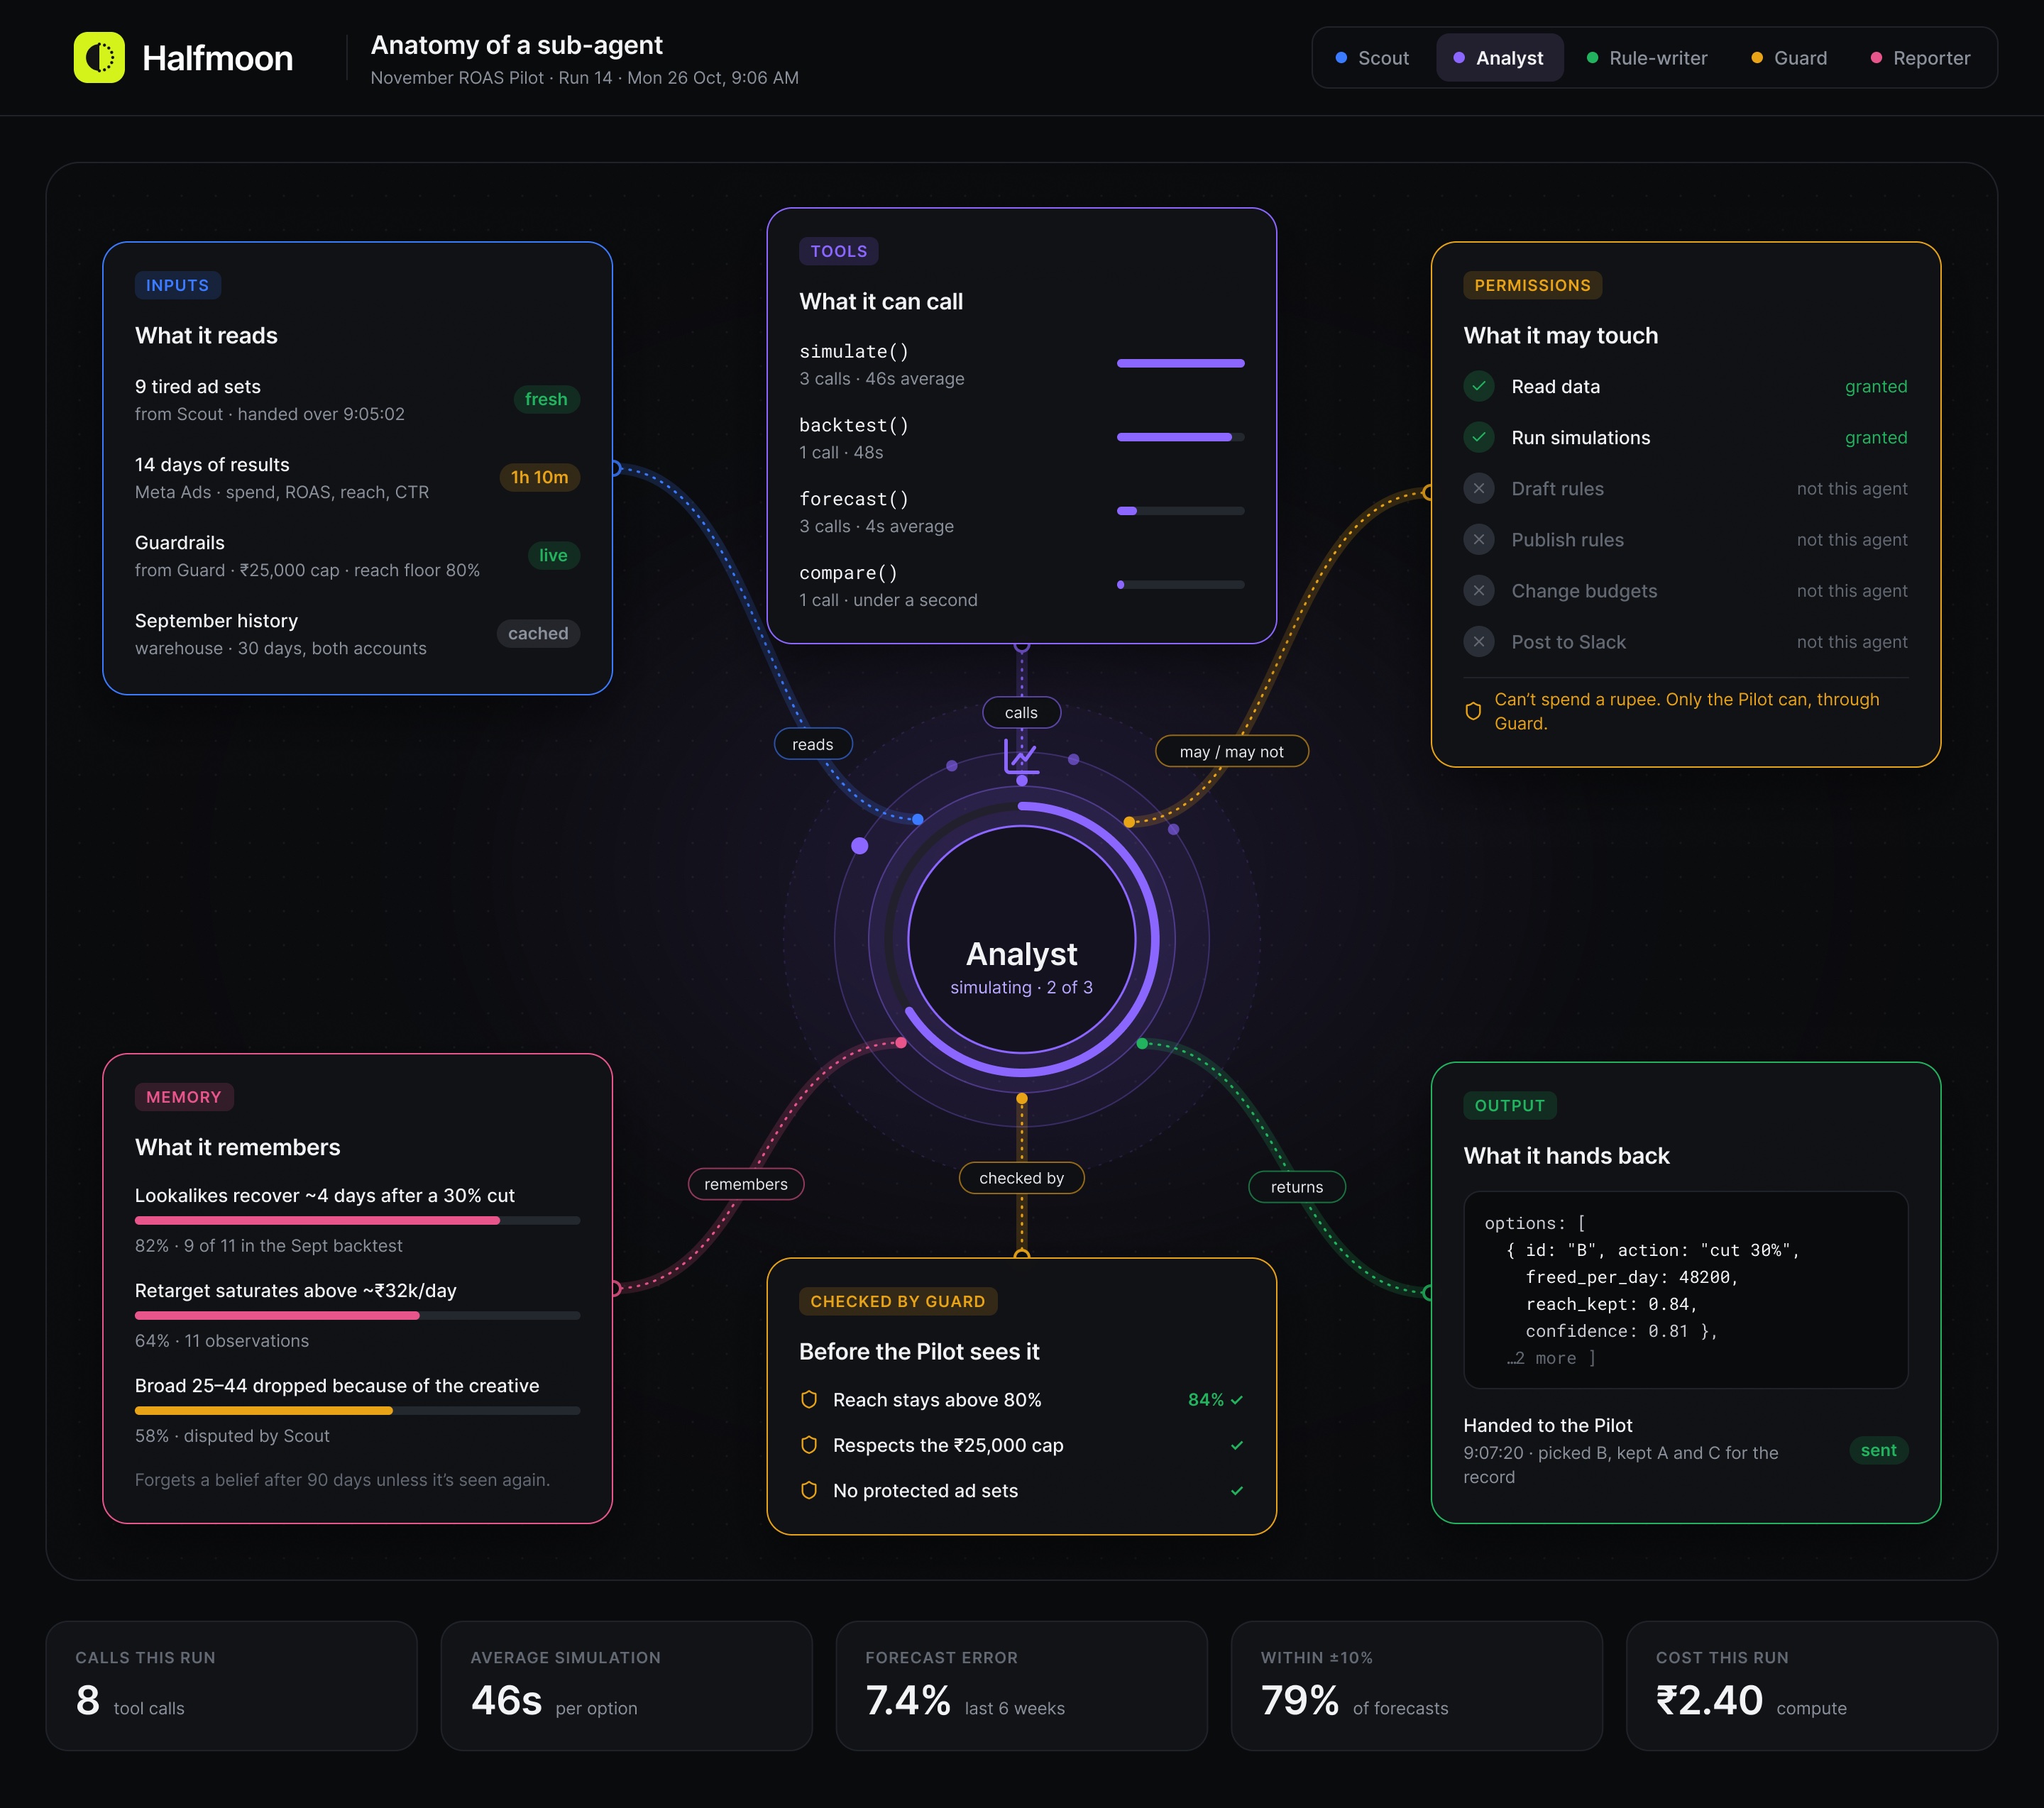
- Designed the agent layer: mission control, the hand-off timeline, sub-agent anatomy and the reasoning graph.
- Built the Style 1 component system in Figma, then rebuilt the two hardest screens in code for this page.
Choices Were Made
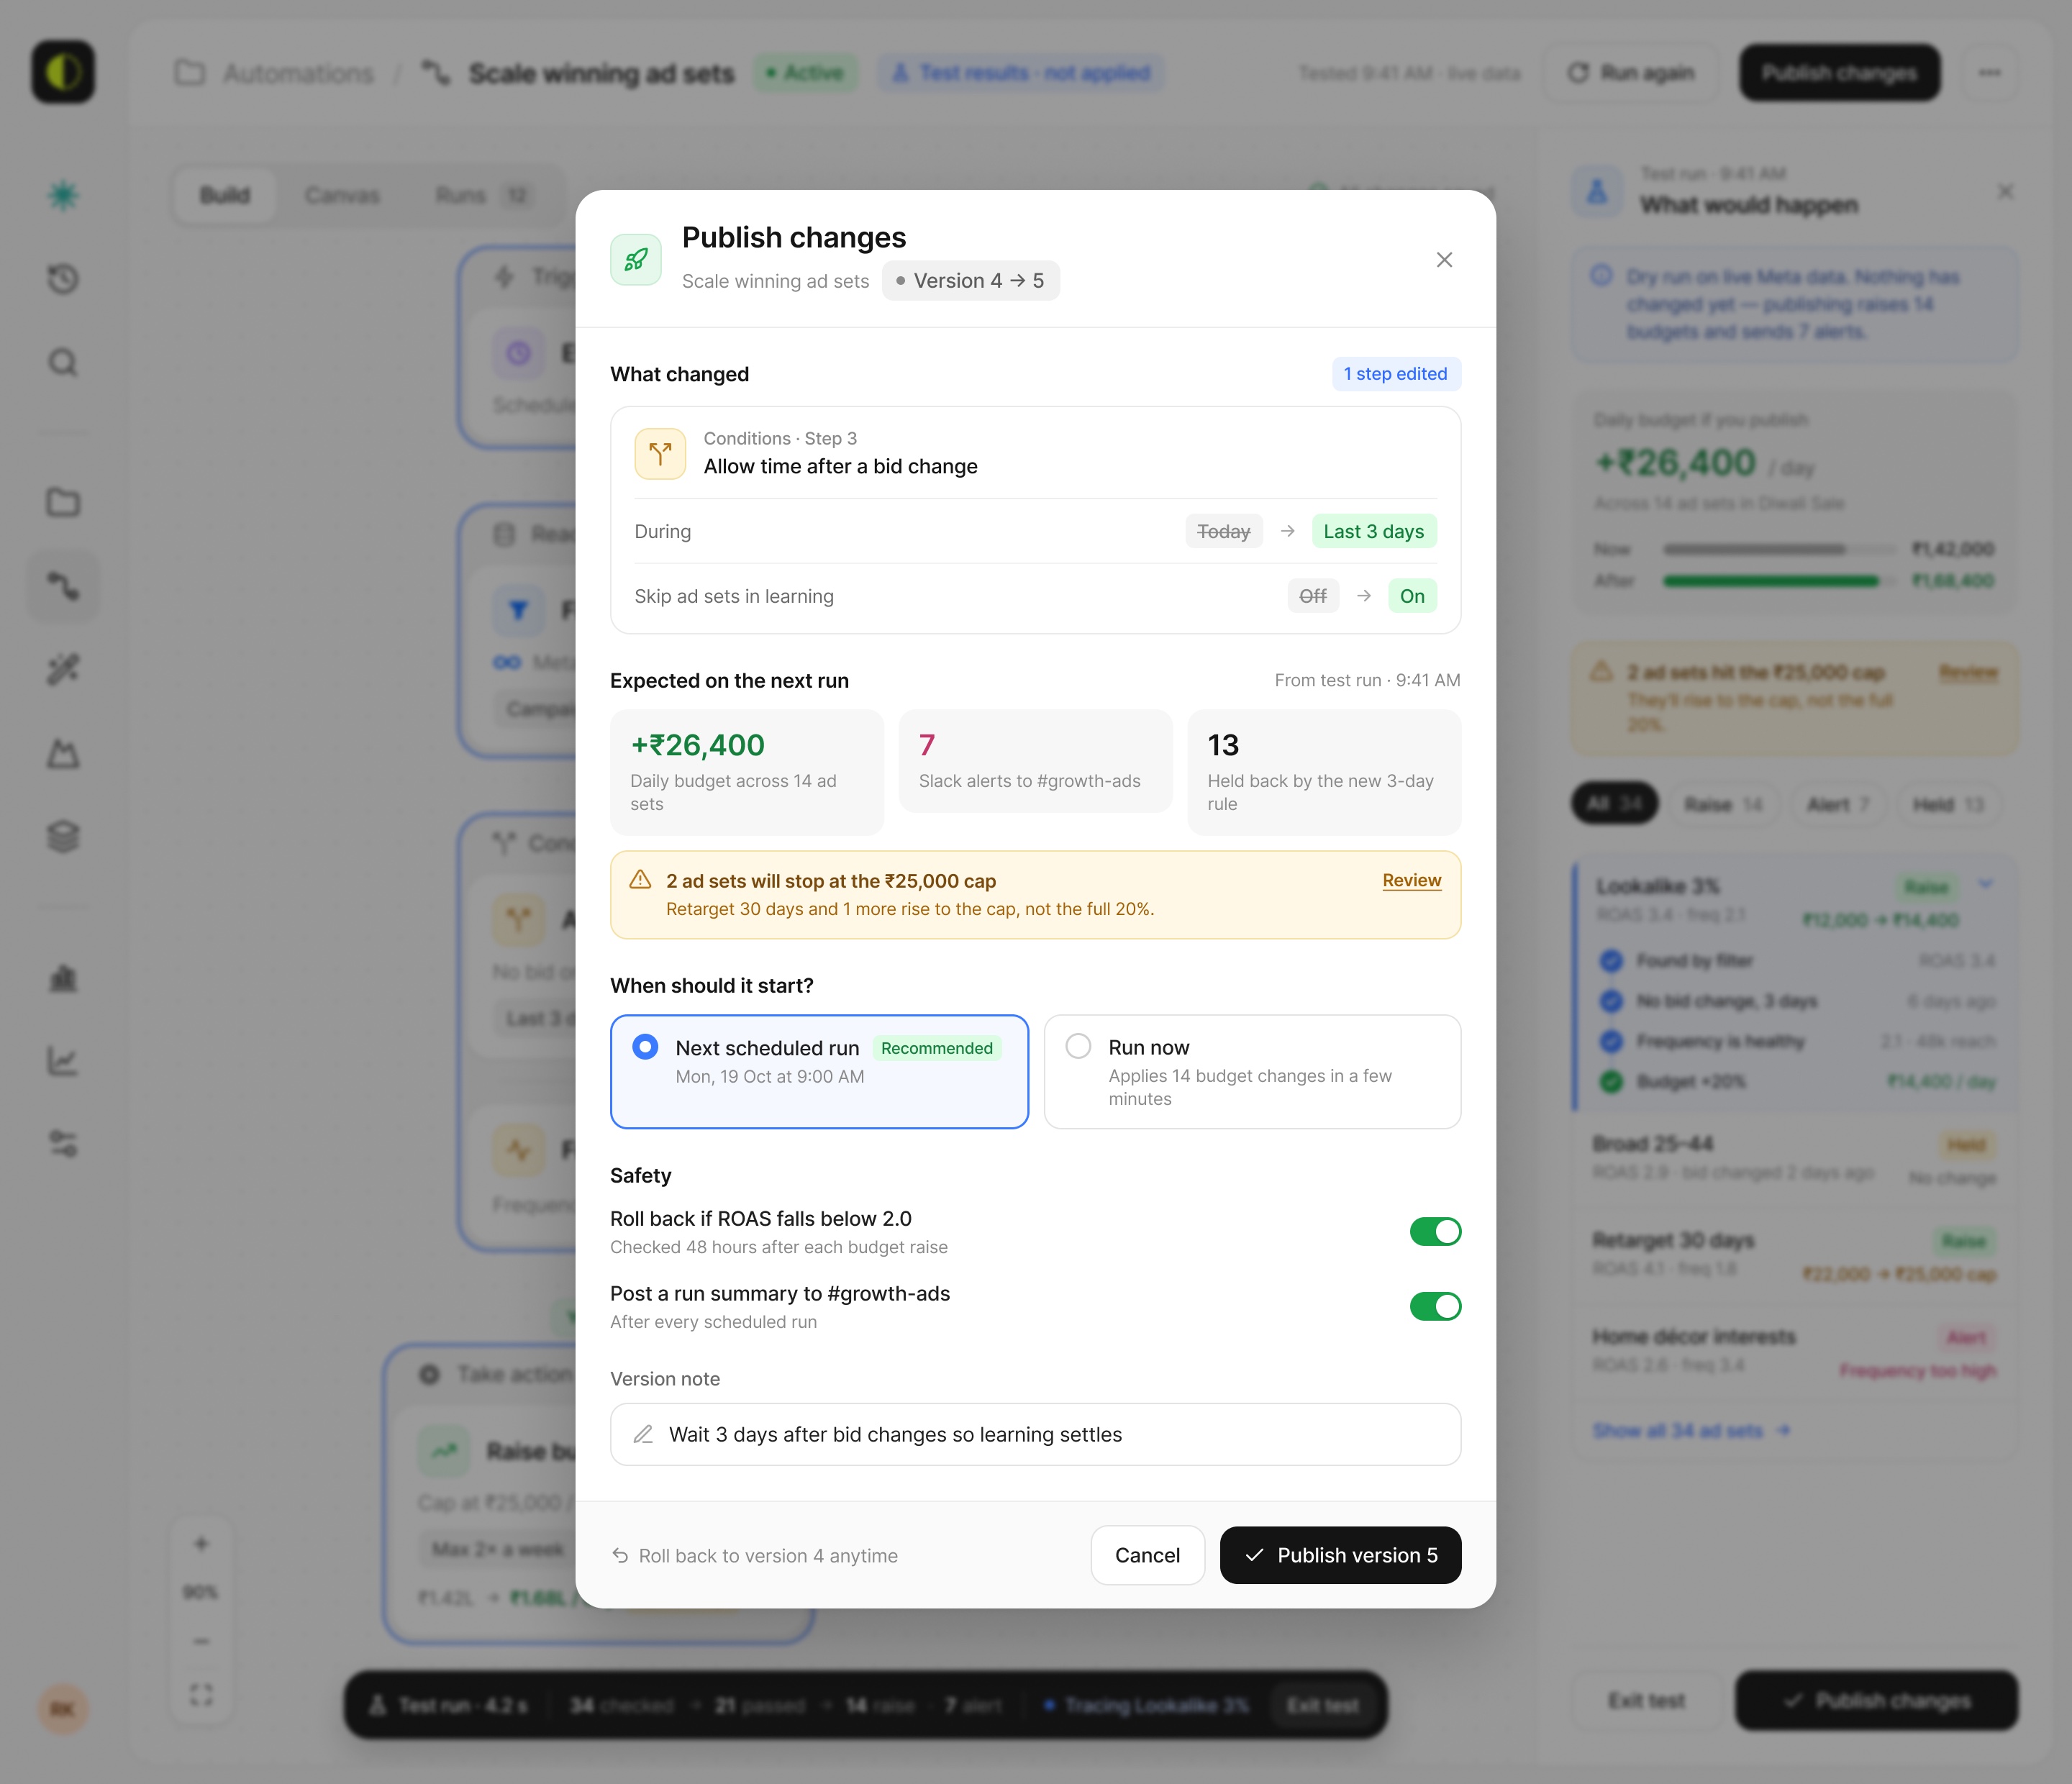
- A test run and a simulation come before every publish.
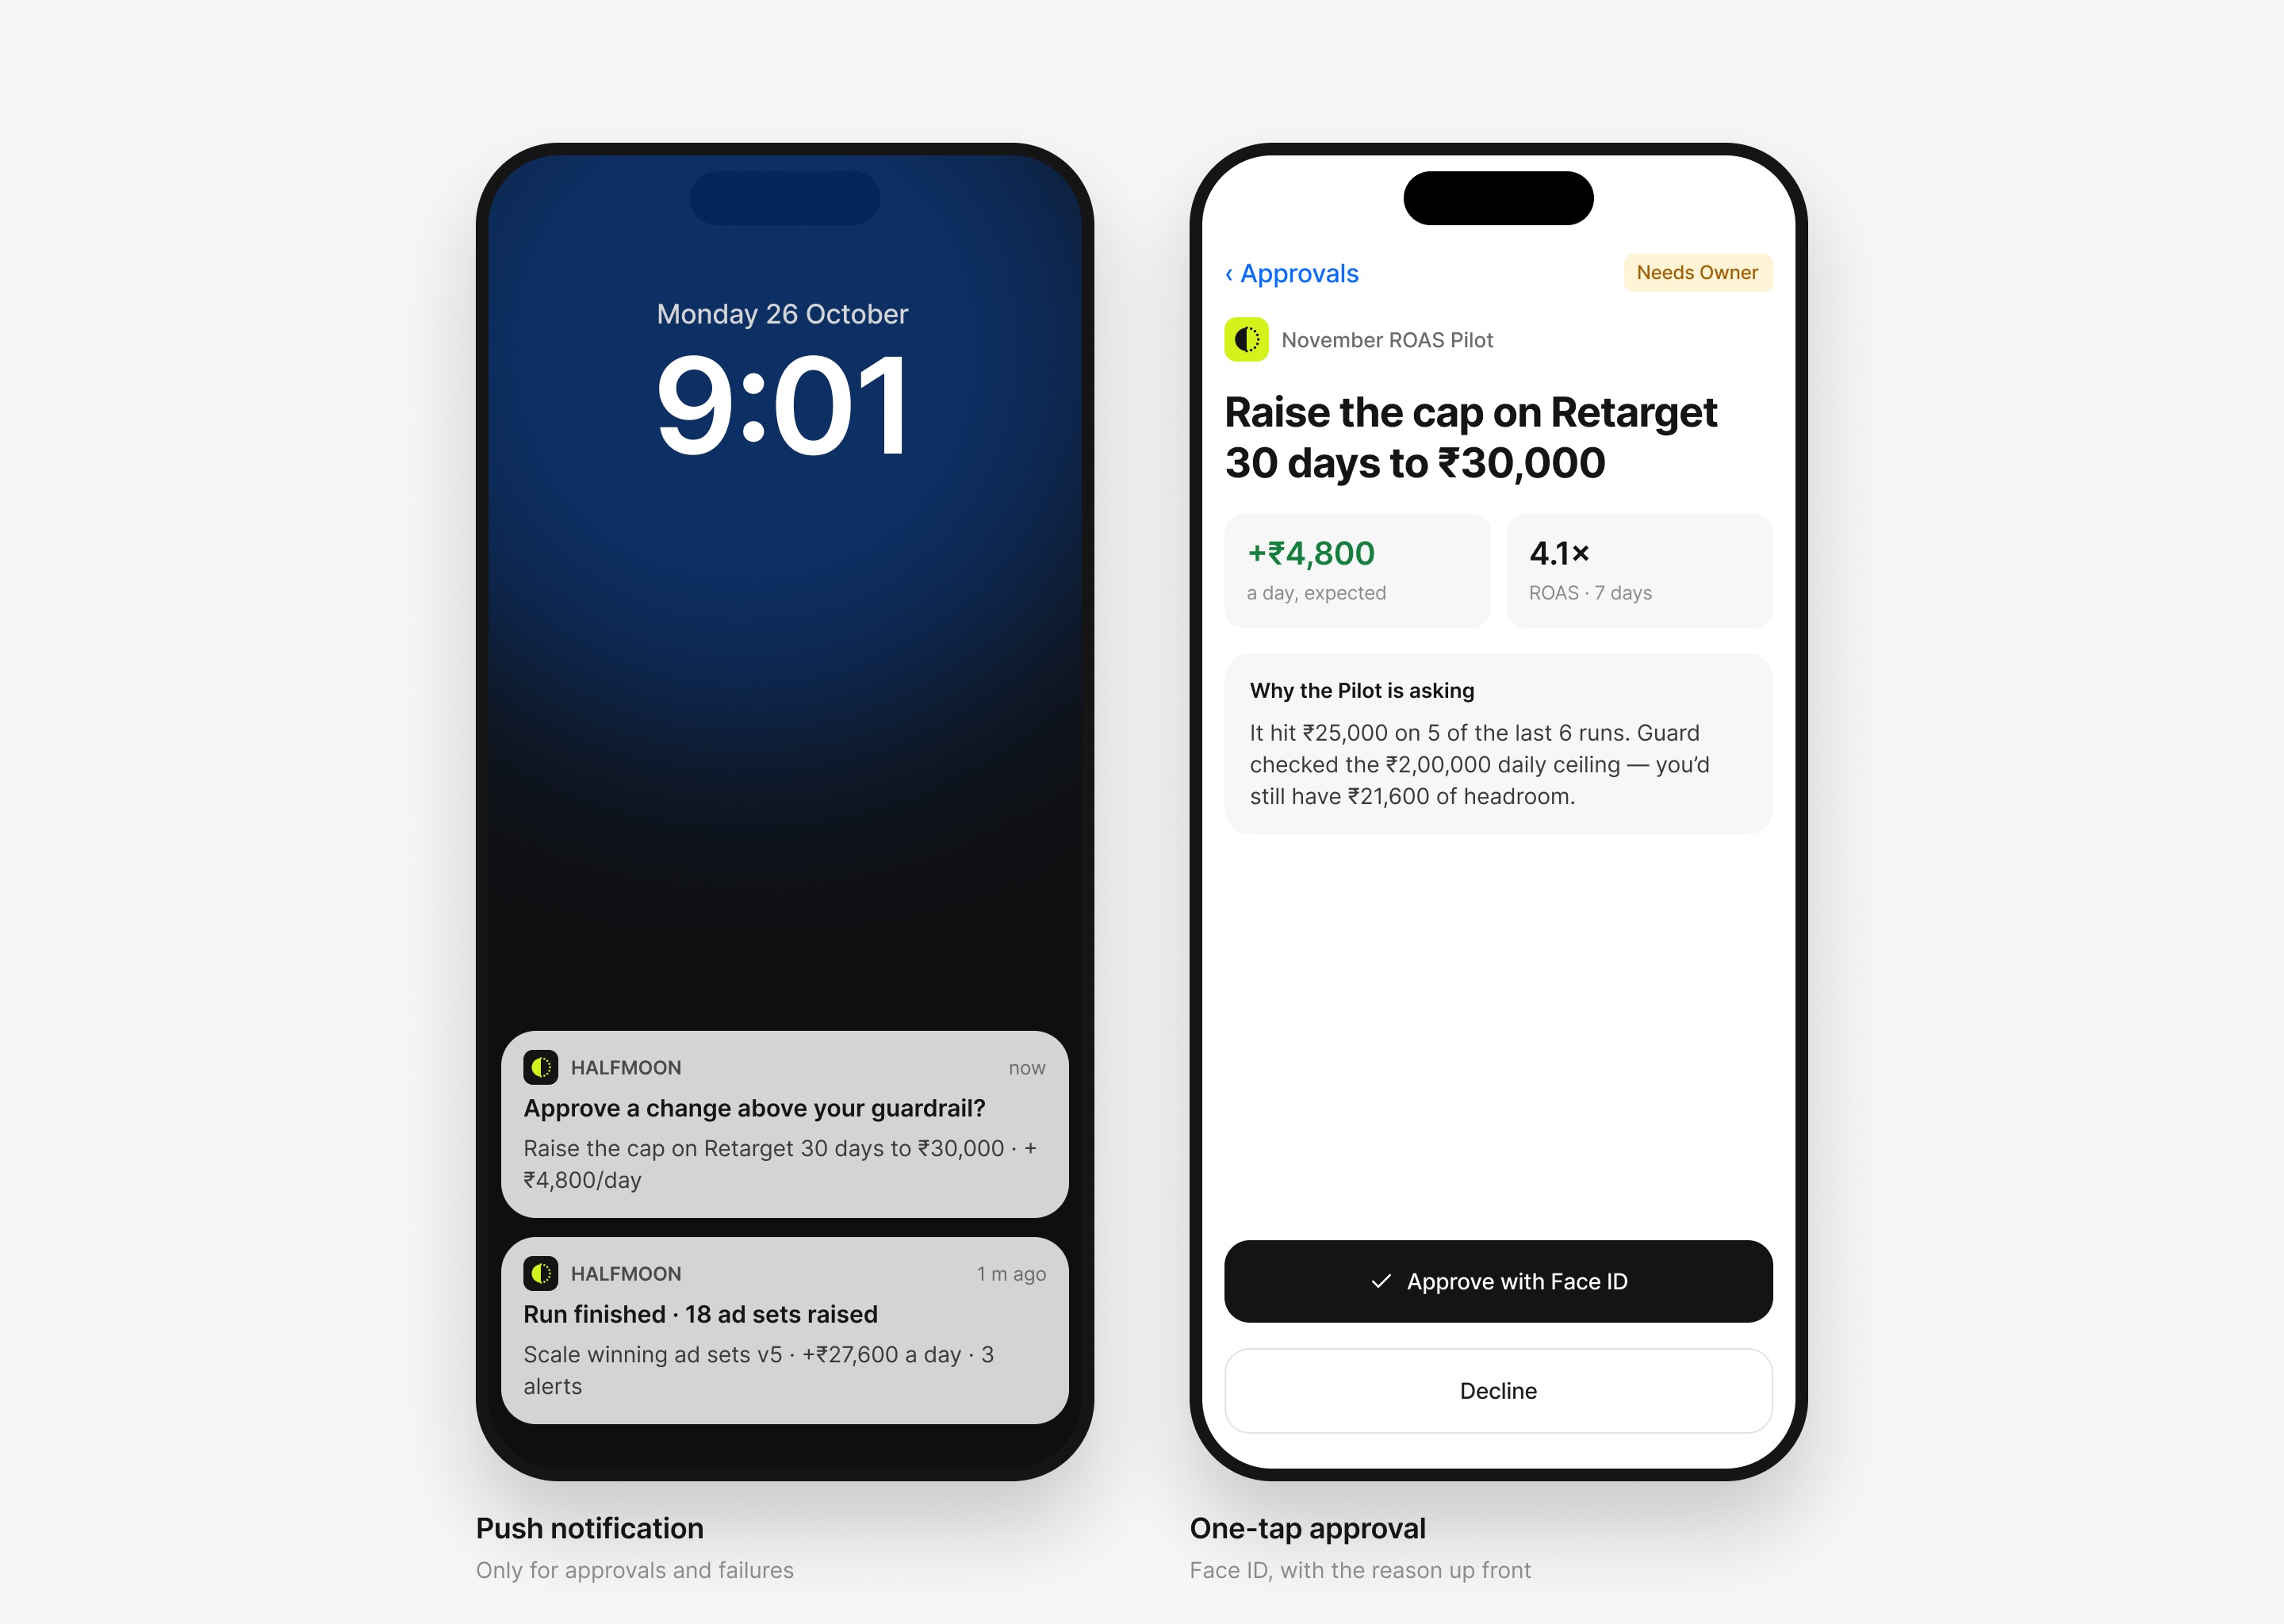
- Only a person can lift a guardrail. Agents can ask, and Guard routes the ask to the Owner.
- Confidence is a number with evidence under it, never a tone of voice.
- Ruled-out options stay on screen, so you can see why they lost.
- “Stop all agents” is always visible, always red and never in a menu.
Why I made this
AI is about to spend real money. Someone has to design the part where you decide to believe it.
01 / Agents are arriving in ad accounts
Ad platforms are adding agents that raise budgets, pause ads and write rules by themselves. The models improve every few months. The screens around them still show a status light and a log file. I wanted to work on what sits between the two: the moment a marketer reads what the machine wants to do and decides yes or no.
02 / Confidence is the product
Every screen answers a question a growth lead asks at 9 AM. What will this rule do? What changed overnight? Why did the agent ask for more money? What happens if I say no? If a screen couldn’t answer its question in a glance, it didn’t make the cut.
03 / Stakes you can count
I picked ad spend because every decision has a rupee figure, a deadline and an owner who gets the blame if it goes wrong. That leaves no room for vague AI design. A sparkle icon and “AI suggests” won’t survive a ₹30,000 question.
04 / One story, start to finish
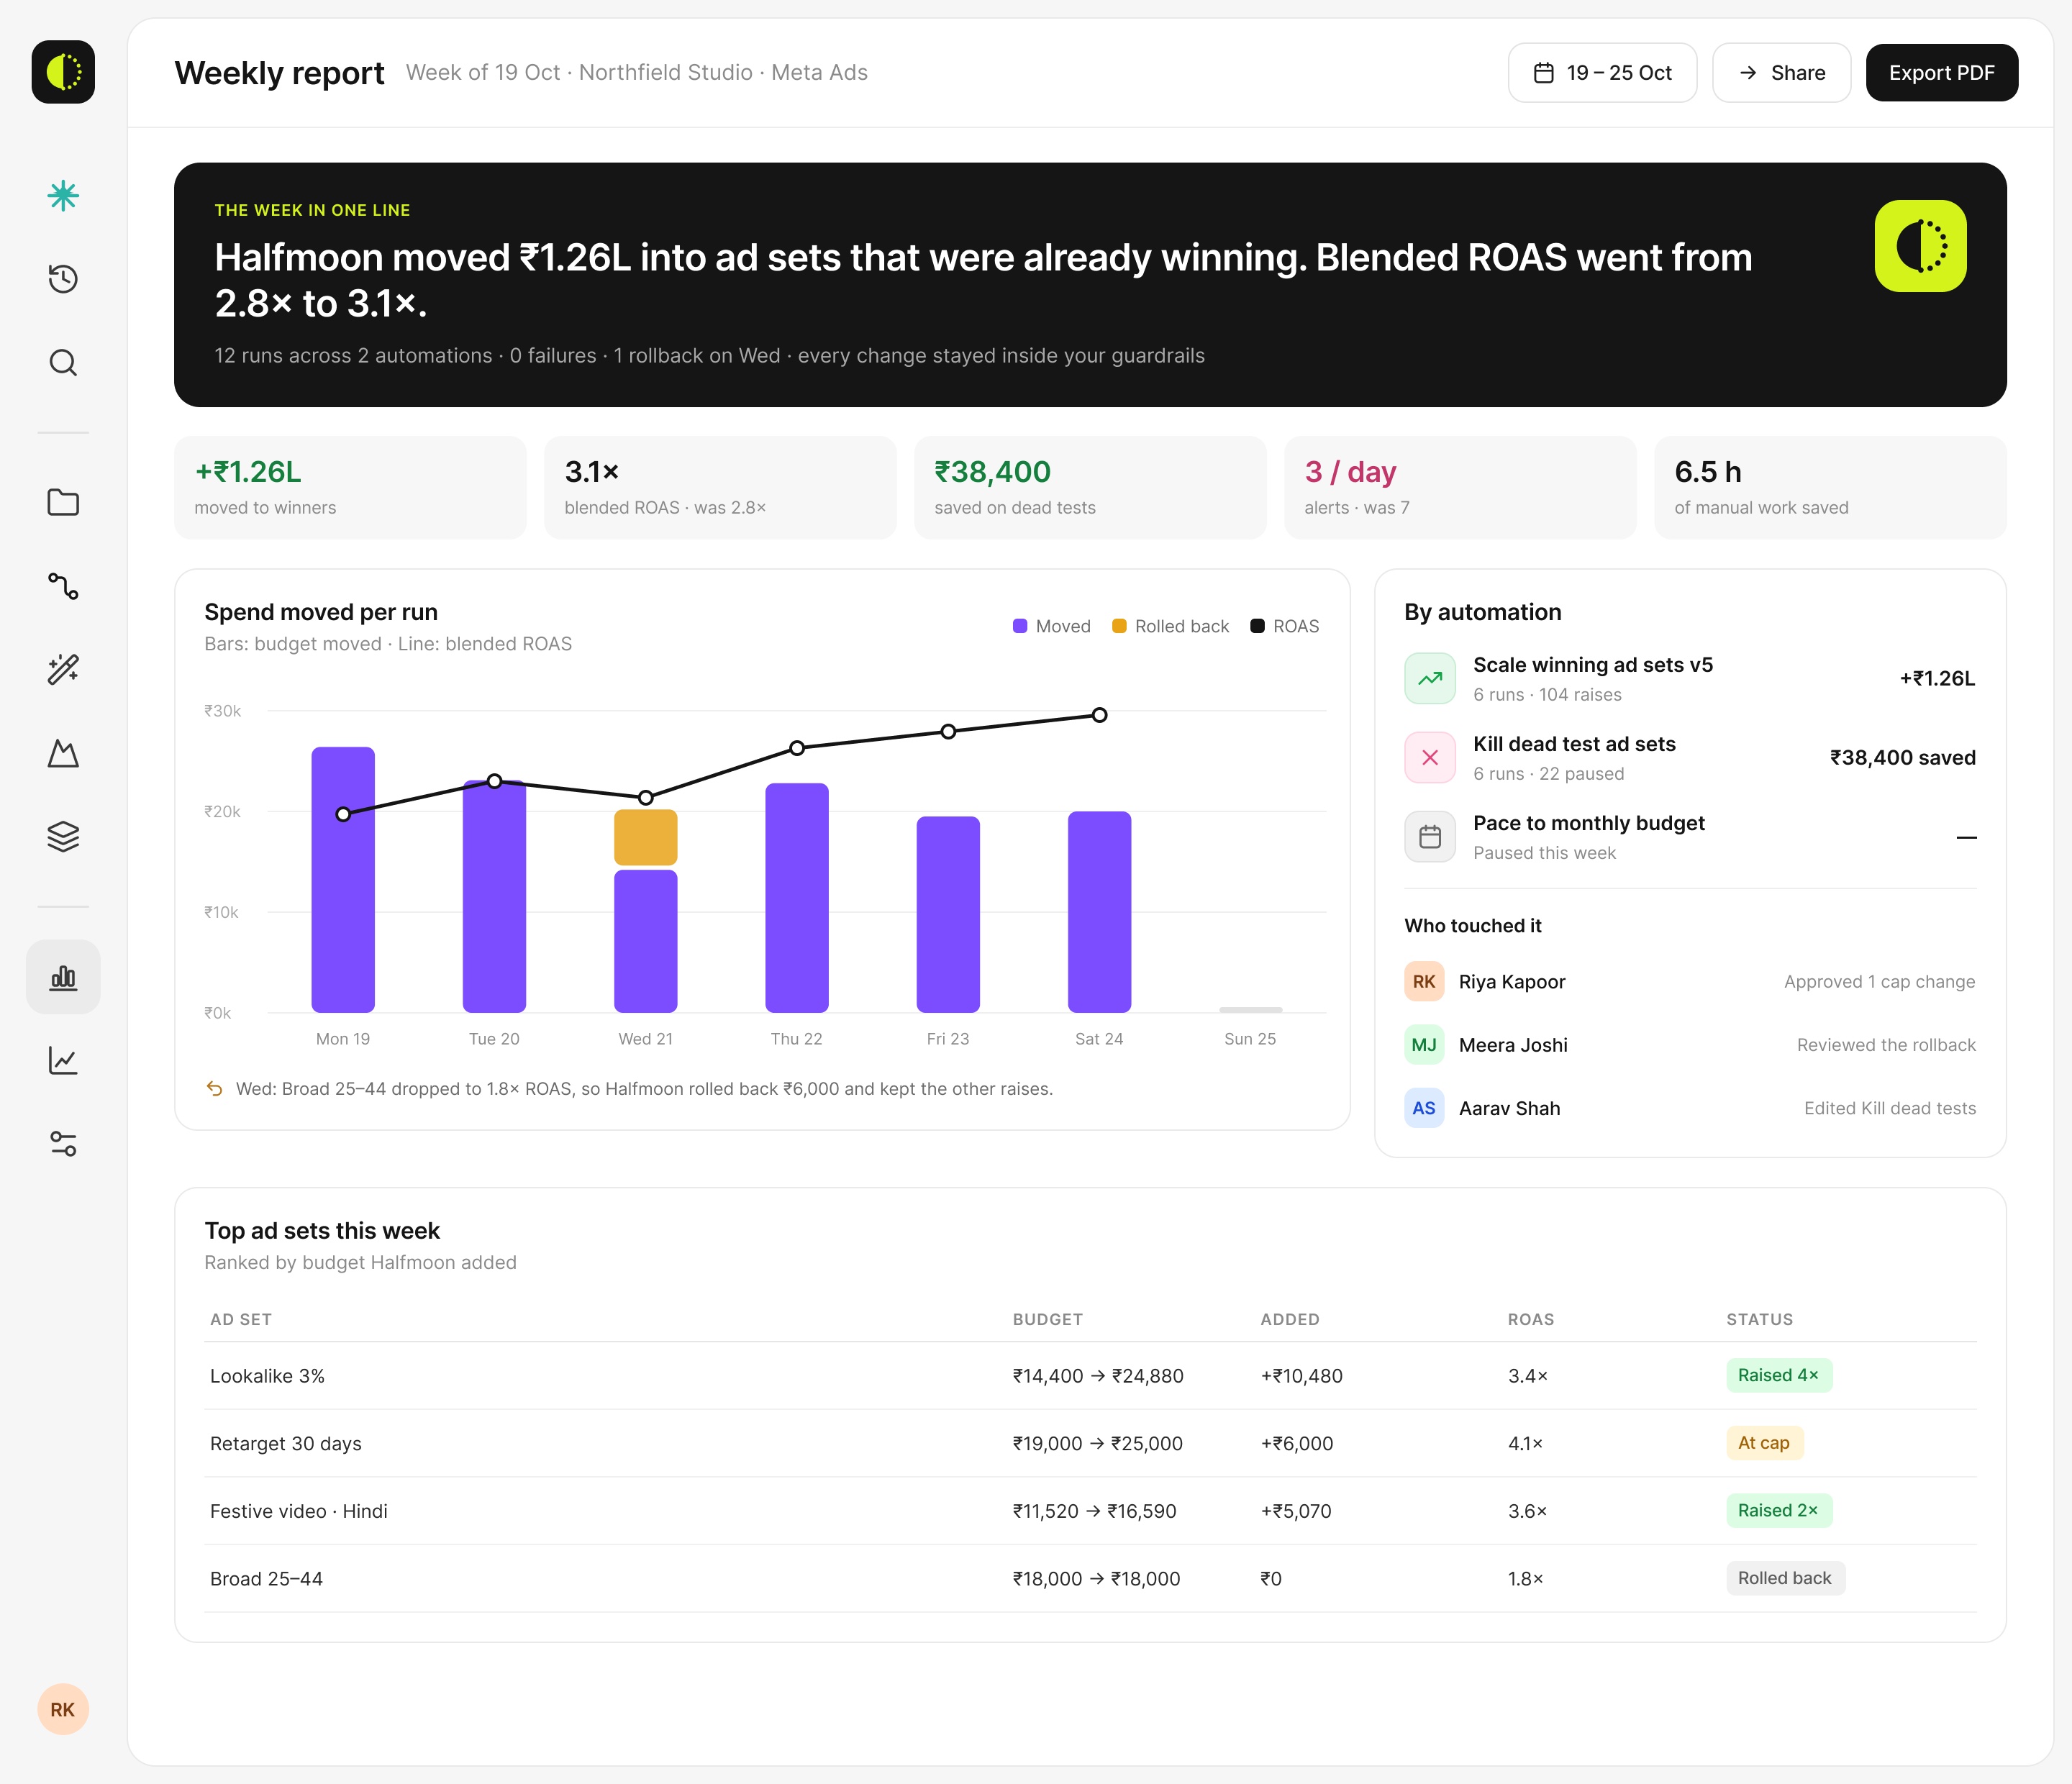
The same 34 ad sets, the same ₹25,000 cap and the same Run 14 thread through every screen. 21 clear the bid rule, 18 get a raise, 3 raise an alert and 13 are held. You can follow one decision from the rule builder to the weekly report, and the numbers agree everywhere.
Live screen 1 · The simulator
What happens if we tweak the rule?
The published rule, v5, raises 14 ad sets and pings the team about 7 more every morning. This screen lets a marketer change its thresholds and see the result on the last 14 days of real data before anything goes live. It runs a real rule engine over 54 ad sets, so every number, band and dot here is computed from the knobs.
- 1 Watch Copilot turn v5 into Simulation B
- 2 Drag the blue line on the scatter
- 3 Hover a band or a dot to see the ad sets
- 4 Press Try another, then Why these numbers?
How 34 ad sets flow through the rules
v5 as published · each band is one or more ad sets
ROAS × frequency
Drag the blue line to test a limit
Daily budget · next 14 days
Raises run at most twice a week
Runs · last 14 days and the next 3, simulated
Mon–Sat at 9:00 AM · Sundays off
- Nothing is appliedThe blue note never goes away while you play. A simulation can be saved or applied to a draft, and it still has to pass a test run and review before it can go live.
- One flow, four questionsWas it found, did it clear the bid rule, is the audience still fresh, and what happens to it? Each band is a group of ad sets you can hover.
- Moved vs v5The dashed blue band is the difference from the live rule. That difference is the actual decision a marketer is making.
- Drag the threshold, not a numberThe frequency limit is a line on the scatter. Ad sets change colour as it crosses them, so you can see who a limit affects before you set it.
- Copilot explains, you decideCopilot can propose a scenario and say what changed in plain words. It can’t apply anything on its own.
- Every number has a comparisonEach number is shown next to v5’s, so you never have to remember what “normal” was.
Live screen 2 · The reasoning graph
Why did the Pilot ask for ₹30,000?
This is L3, the reasoning graph, rebuilt in code from the Figma file. It reads left to right like a sentence: because, so, therefore, ask. Watch the argument build, open any card to see its raw data and what it led to, then drag a tripwire to change the Pilot’s mind.
- 1 Replay decision
- 2 Click any card to trace it
- 3 Drag a tripwire past its line
- 4 Approve as Riya
Why the Pilot asked for ₹30,000
Edge width = how much that node moved the decision. Click any node for its raw data.
If Riya says no
- Keeps ₹25,000
- Retarget stays capped · ~₹4,800/day left on the table
- Over November
- ≈ ₹1.4L of revenue the model expects to miss
- Pilot’s next move
- Re-asks with A (₹27,500) on Thu if ROAS still ≥ 4×
What would change the Pilot’s mind
It re-checks these before every run. Drag one past its trip point.
Bar = how far today’s number is from the trip point- EvidenceFacts from Scout, Shopify and Guard, each with the small chart that proves it.
- AnalysisThe Analyst’s models: marginal ROAS above the cap, a September backtest and a forecast range.
- How much each fact matteredLine thickness and the % pill show how far each node moved the decision.
- Ruled-out options stay visibleOption C would drop marginal ROAS under the 2.5× floor. It stays on the graph so you can see why.
- Guard, then youSeven checks. The one that fails, the per-ad-set cap, is exactly why a person has to approve.
- TripwiresThe three numbers that would change the Pilot’s mind. Here you can push them and watch the graph re-route.
Selected screens
8 screens from the Figma file · Desktop 1440