Case study
Recruiting Operations Dashboard
Turning recruiting activity into a decision system
at SeekOut ↗︎TL;DR
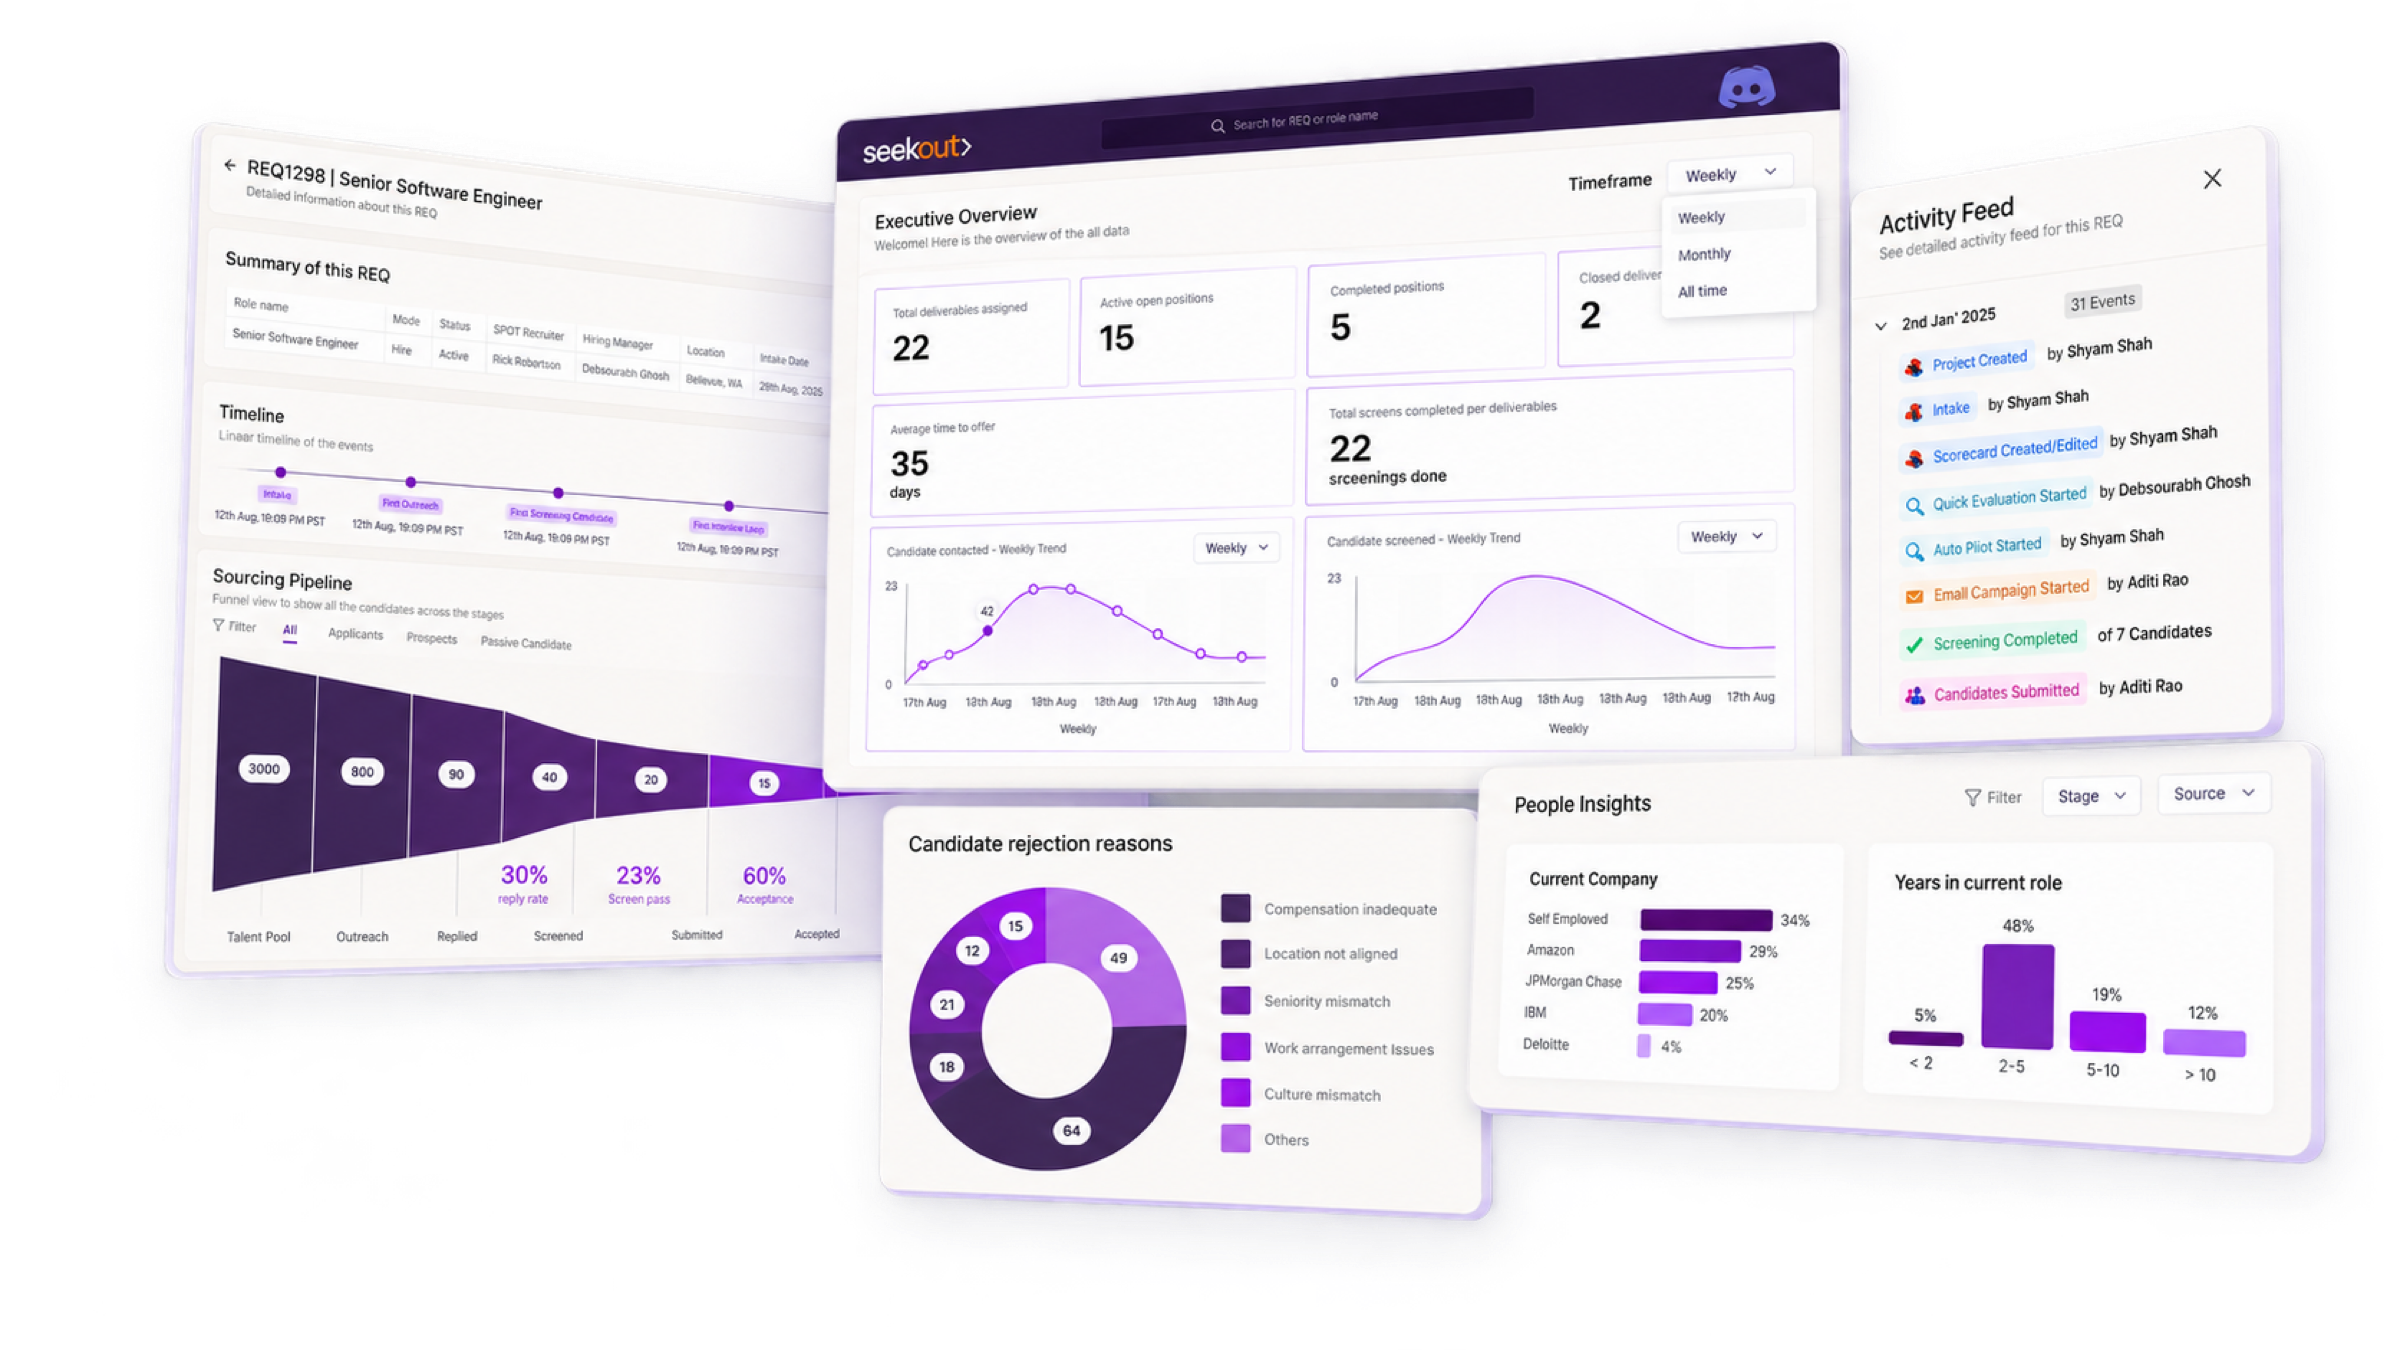
Recruiting teams could see their numbers but couldn’t say what drove them. I designed a dashboard that runs from portfolio health down to the candidate behind each number, so leaders can spot a problem and recruiters can trace it. It shipped at SeekOut.
Choose your depth
The problem, my contribution, outcomes, and strongest screens.
My role
Product design · Analytics strategy · Enterprise workflows
Product focus
A recruiting dashboard that links portfolio health to the requisitions and candidates behind it.
The Mess
Nobody was short on reports. What the team couldn’t do was point at a stalled requisition and say why, because the numbers sat apart from the activity and people behind them.
The Short Version
One dashboard in layers. Leaders scan the whole portfolio, then drill into a requisition, its activity and the candidates behind every number, with filters and dates visible all the way down.
My Part in This
- Designed the layers, from portfolio health down to candidate evidence.
- Put conversion, rejection and people insights next to the headline numbers.
- Made activity traceable by date, person, event type and volume.
What Got Better
- Anyone can go from a headline number to the activity and evidence behind it.
- Filters, dates and people stay attached to every number on the way down.
Impact
What Actually Moved
For the Business
Put executive health, requisition performance, team activity and candidate evidence in one operating view.
For the Humans
Recruiting teams get from a headline result to its cause without rebuilding context across reports.
For the Spreadsheet
Shows SeekOut’s value through recruiting outcomes teams can measure, which supports adoption and retention.
Highlights evidence
3 essential screens from the final experience.
Continue reading